Seattle continues to hover above .500, while Baltimore is trying to claw back into the AL Wild Card picture after an inconsistent start.
Recent Team Form
Seattle Mariners — Last 10 Games: 6–4
Offense showing signs of life after a sluggish May
Rotation has stabilized; bullpen remains a strength
Hancock coming off two strong outings (3 ER or fewer in each)
Baltimore Orioles — Last 10 Games: 4–6
Inconsistent run production
Bullpen has been overworked
Starting pitching remains unsettled, hence the TBD designation
Injury Report
Seattle Mariners
J.P. Crawford — Probable (wrist soreness)
Andrés Muñoz — Questionable (shoulder fatigue)
Dominic Canzone — Out (oblique)
Baltimore Orioles
Gunnar Henderson — Probable (hamstring tightness)
John Means — Out (elbow)
Kyle Bradish — Out (UCL recovery)
Baltimore’s rotation injuries are a major reason for the TBD starter.
Key Player Matchups
Emerson Hancock (SEA) vs. Orioles Lineup
Hancock’s sinker‑slider combo has been sharp, generating ground balls at a high rate. Baltimore’s lineup, however, features several right‑handed hitters who feast on mistakes up in the zone.
Key battlegrounds:
Hancock vs. Adley Rutschman — Rutschman’s plate discipline could force Hancock into deep counts.
Hancock vs. Anthony Santander — Santander’s pull power is dangerous with wind blowing to left.
TBD (BAL) vs. Mariners Lineup
Baltimore could opt for:
Cole Irvin (LHP) — if they want a traditional starter
Albert Suárez (RHP) — if they want a bulk innings arm
Bullpen game — if they want matchup flexibility
Key battlegrounds:
Julio Rodríguez vs. LHP — If Irvin starts, J‑Rod becomes a major advantage for Seattle.
Cal Raleigh vs. RHP — Raleigh’s power plays extremely well at Camden Yards.
Ty France vs. cutters — France has been heating up against right‑handed cutters and sinkers.
Series History
2025 Season: Mariners won 4–2
2026 Season: First meeting
Trend: Seattle has won six of the last eight head‑to‑head matchups
At Camden Yards: Mariners have taken three straight series in Baltimore
Betting Trends
Seattle Mariners
5–1 in last six road games
Under has hit in 7 of last 10
Hancock starts: SEA is 4–2 ATS in his last six outings
Baltimore Orioles
2–5 in last seven home games
Over has hit in 6 of last 8
Orioles are 1–4 in games started by a TBD/bullpen configuration this season
Head‑to‑Head Trends
Mariners are 7–3 in last 10 vs. Orioles
Unders have hit in five straight meetings at Camden Yards
Suggested Wagering Model
Model Projection
Mariners 5, Orioles 3
Projected Spread: SEA -1.5
Projected Total: 8.1
GAME ODDS
Seattle Mariners – 126
Baltimore Orioles 9
Odds Courtesy of Sports Odds Direct as of Sunday, June 7, 2026
Club Options LHP Joe La Sorsa to Triple-A Worcester
BOSTON, MA – The Boston Red Sox today recalled infielder/outfielder Nate Eaton from Triple-A Worcester. To make room, Boston optioned left-handed pitcher Joe La Sorsa to Triple-A Worcester.
Eaton, 29, has played in 48 games for Worcester this season, hitting .283 (51-for-180) with 11 doubles, two triples, five home runs, 22 RBI, 31 runs scored, and a .798 OPS while making 26 starts in center field, nine in right field, eight in left field, and two as the designated hitter. The right-handed hitter played in 41 games for Boston in 2025, batting .296 (24-for-81) with four doubles, one home run, 16 runs scored, and nine stolen bases. Originally selected by the Kansas City Royals in the 21st round of the 2018 First-Year Player Draft, the Virginia native has hit .233 (56-for-240) in 113 career Major League Games for the Royals (2022-23) and Red Sox (2025).
La Sorsa, 28, pitched in the eighth inning of yesterday’s game against the New York Yankees after being acquired from the Pittsburgh Pirates in exchange for cash considerations on Thursday. The left-hander has also posted a 3.46 ERA (10 ER/26.0 IP) with a 1.08 WHIP and 22 strikeouts in 22 games (two starts) for Triple-A Indianapolis this season. Originally drafted by the Tampa Bay Rays in the 18th round of the 2019 First-Year Player Draft, the New York native owns a 5.34 ERA (34 ER/57.1 IP) with 45 strikeouts in 47 career Major League games for the Rays (2023), Washington Nationals (2023-24), Cincinnati Reds (2025), and Red Sox (2026).
The Knicks return home with a commanding 2–0 series lead, while the Spurs arrive in Manhattan searching for answers after two tightly contested but ultimately frustrating losses. Game 3 at MSG now becomes the hinge point of the series: New York can seize total control, or San Antonio can breathe life back into the matchup.
Venue: Madison Square Garden
Location: 4 Pennsylvania Plaza, New York, NY
Capacity: ~19,800 for basketball
Atmosphere Expectation: Electric. Knicks fans sense a potential 3–0 stranglehold, and the Garden has been deafening throughout the postseason. Young Spurs players will be tested by the environment.
Team Records & Series Status
San Antonio Spurs: 0–2
New York Knicks: 2–0
Series: Knicks lead 2–0 (best‑of‑7)
Recent Team Form
San Antonio Spurs (Last 5 Games)
L vs NYK
L vs NYK
W vs OKC
W vs OKC
L vs OKC Trend: Inconsistent. The offense has been functional, but defensive breakdowns late in games have cost them repeatedly.
New York Knicks (Last 5 Games)
W vs SAS
W vs SAS
W vs SAS (regular season finale)
W vs PHI
W vs PHI Trend: Red‑hot. New York has won five straight, leaning on physical defense and elite late‑game execution.
Injury Report
San Antonio Spurs
Devin Vassell — Questionable (ankle) Limited in Game 2; expected to play but not at full mobility.
Jeremy Sochan — Probable (hip tightness) Should be available with a minutes watch.
Charles Bassey — Out (knee)
New York Knicks
Julius Randle — Out (shoulder) Season‑ending injury remains a major storyline, but Knicks have adapted.
Mitchell Robinson — Questionable (foot) Missed Game 2; his rim protection would be a major boost.
Donte DiVincenzo — Probable (hamstring) Expected to play after precautionary rest late in Game 2.
Key Player Matchups
Victor Wembanyama (SAS) vs. Isaiah Hartenstein (NYK)
Wembanyama has been brilliant statistically, but New York’s physicality has forced him into tough spots late in games. Hartenstein’s screens, rebounding, and positional defense have been invaluable.
Jalen Brunson (NYK) vs. Tre Jones (SAS)
Brunson is controlling the series with pace, footwork, and clutch shot‑making. Jones must disrupt his rhythm without fouling—something San Antonio has struggled with.
Keldon Johnson (SAS) vs. OG Anunoby (NYK)
Anunoby’s defense has been suffocating. Johnson needs to find more efficient scoring lanes for the Spurs to stay competitive.
Bench Units
New York’s second unit—led by Josh Hart and Miles McBride—has outplayed San Antonio’s bench by a wide margin. The Spurs need Malaki Branham and Zach Collins to swing momentum.
Series History
2025–26 Regular Season: Knicks swept 2–0
Current Playoff Series: Knicks lead 2–0
All‑Time Playoff Meetings: Rare; franchises have met only twice historically
Trend: New York has won four straight head‑to‑head matchups dating back to 2025.
Betting Trends
Against the Spread (ATS)
Spurs: 1–4 ATS last 5
Knicks: 5–0 ATS last 5
Knicks have covered both games in this series by an average of +7.5 points.
Totals (O/U)
Game 1: Under
Game 2: Over
Knicks home playoff games have leaned Under (7 of last 10).
Moneyline Trends
Knicks have won 8 of their last 9 at MSG.
Spurs are 2–6 in their last eight road playoff games.
Game Odds
San Antonio Spurs 216.5
New York Knicks -2.5
Odds Courtesy of Sports Odds Direct as of Sunday, June 7, 2026
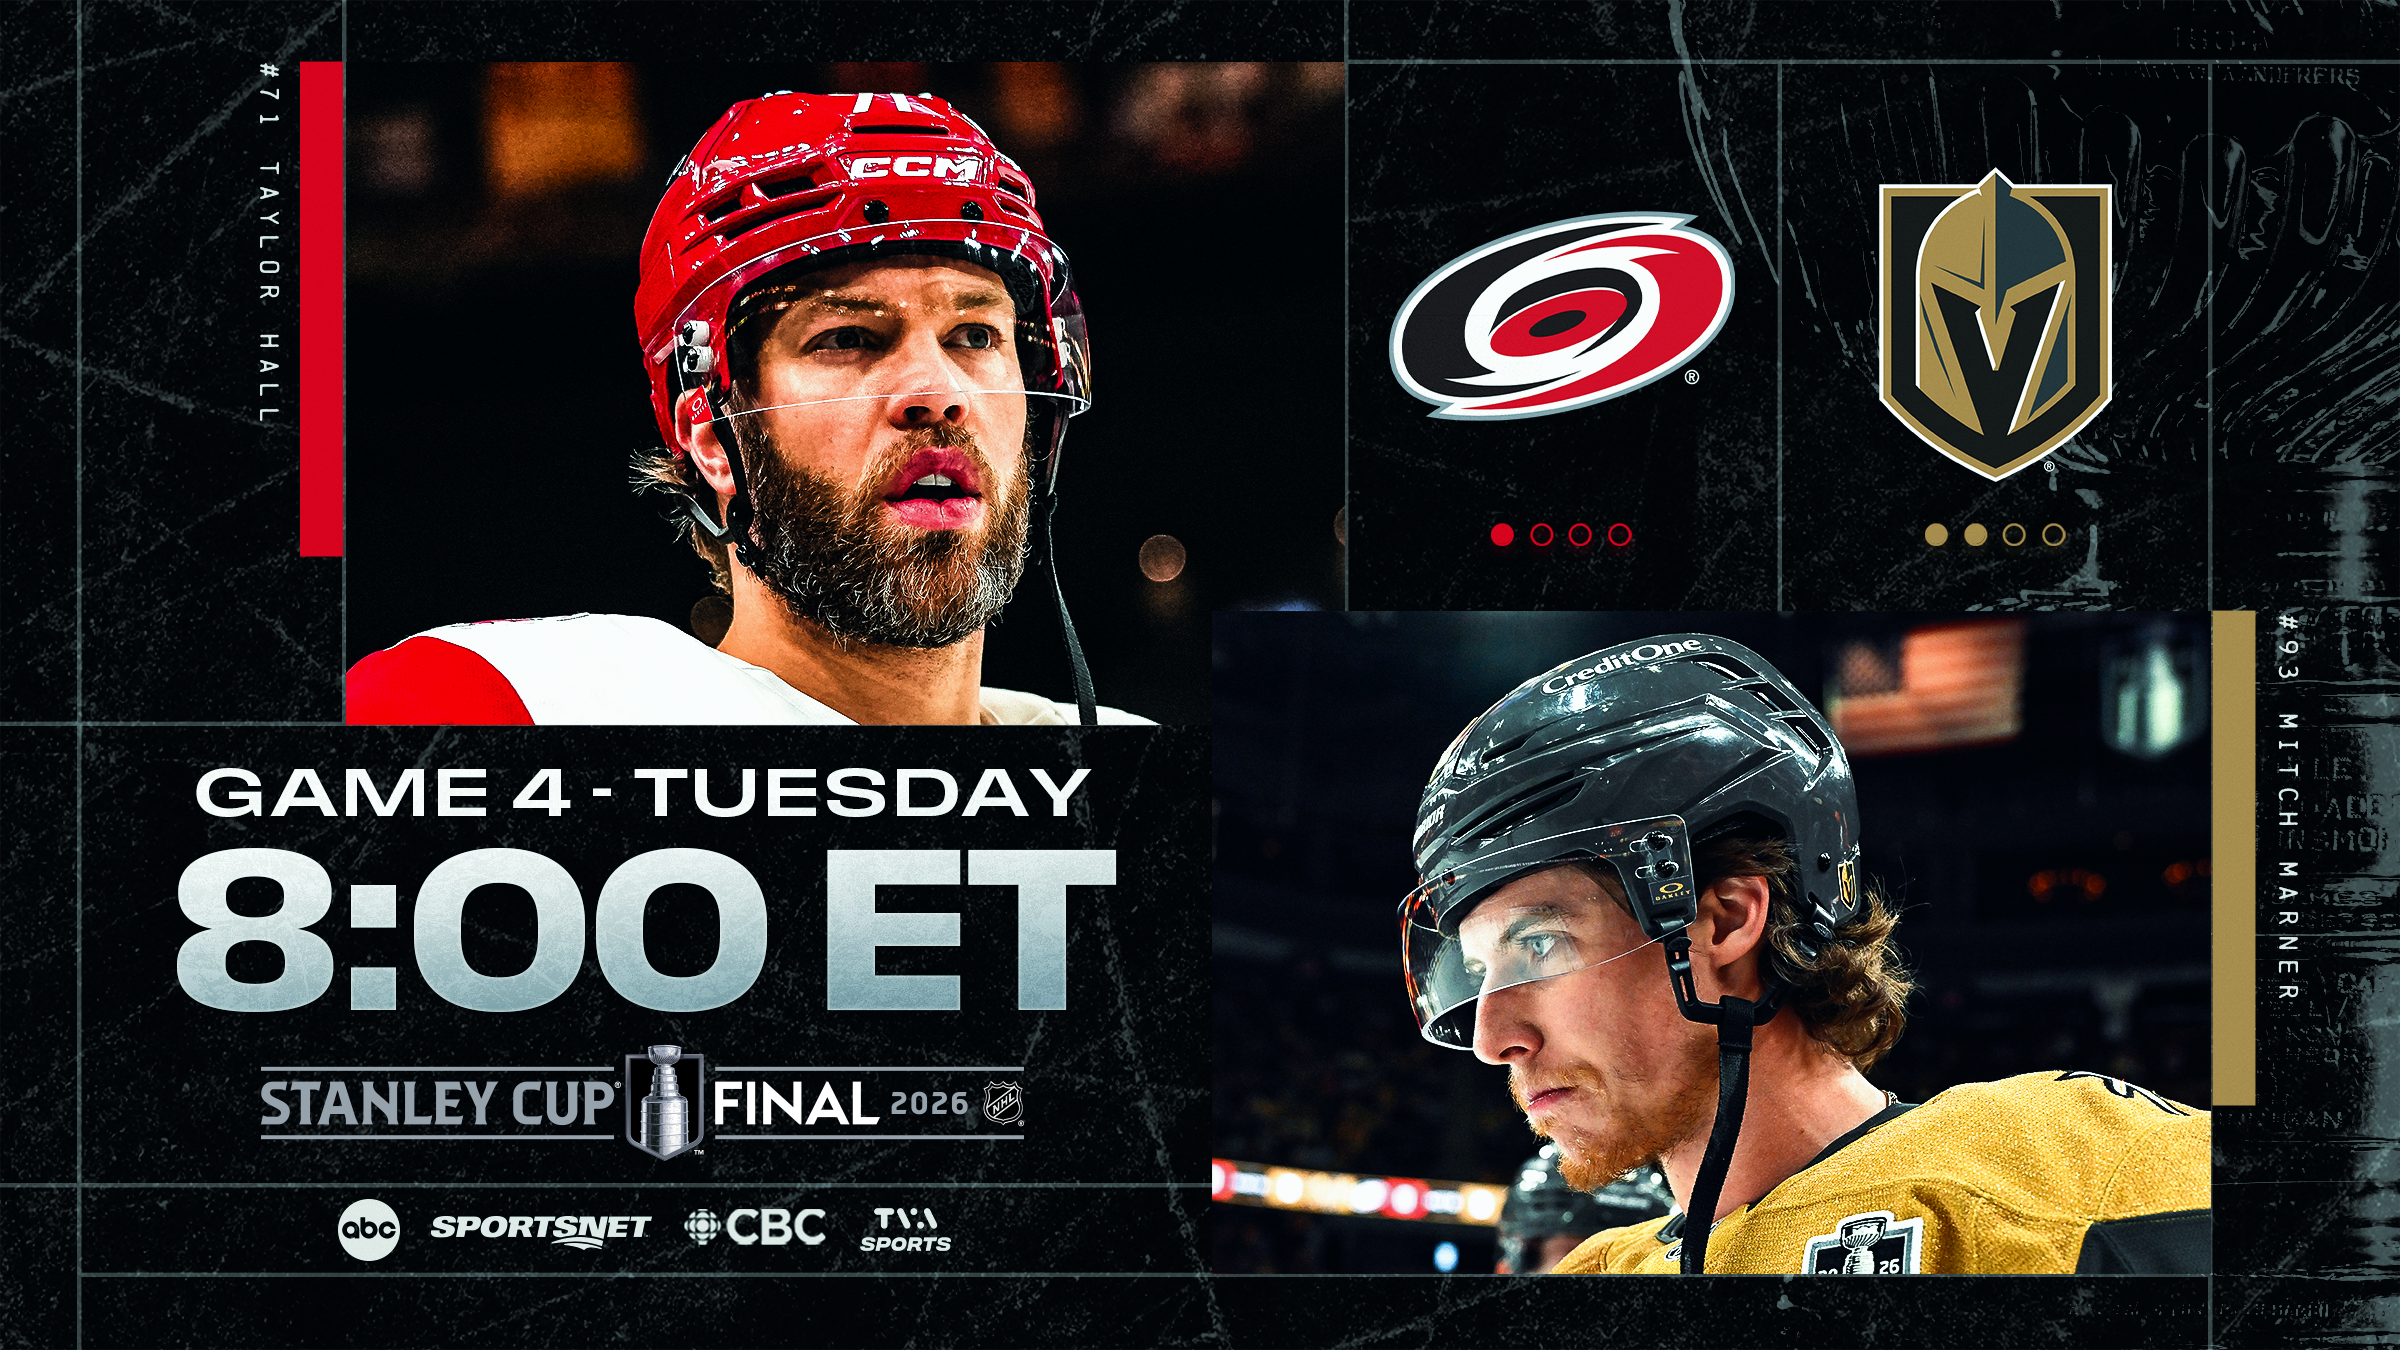
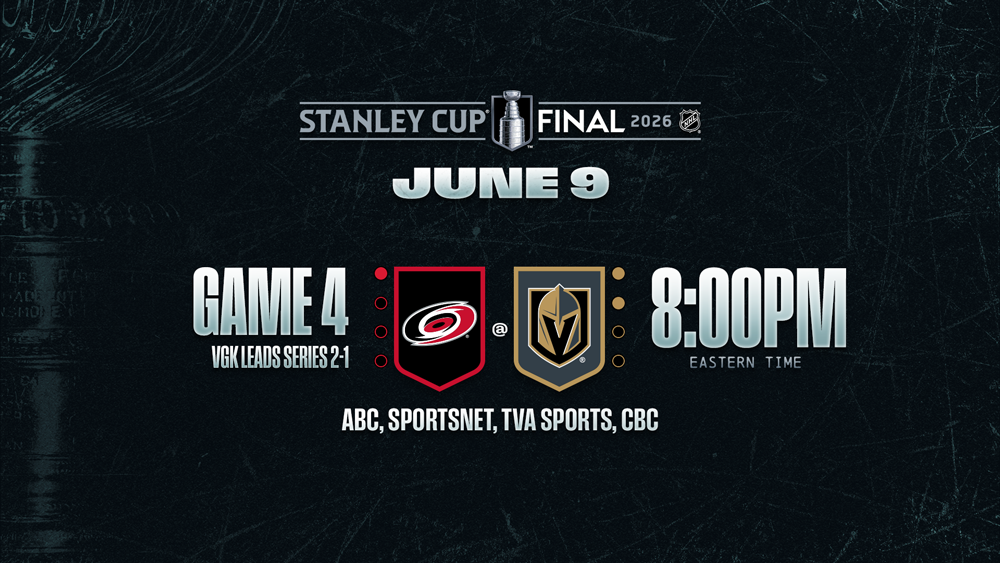
* The Stanley Cup Final continues at T-Mobile Arena with Game 4 tomorrow, where the Golden Knights aim to take a 3-1 series lead as the Hurricanes look to equalize on the road. Teams that take a 3-1 series lead in a best-of-seven Stanley Cup Final own an all-time record of 38-1 (.974), while clubs that trailed 2-1 have won four of the past five Game 4s as visitors.
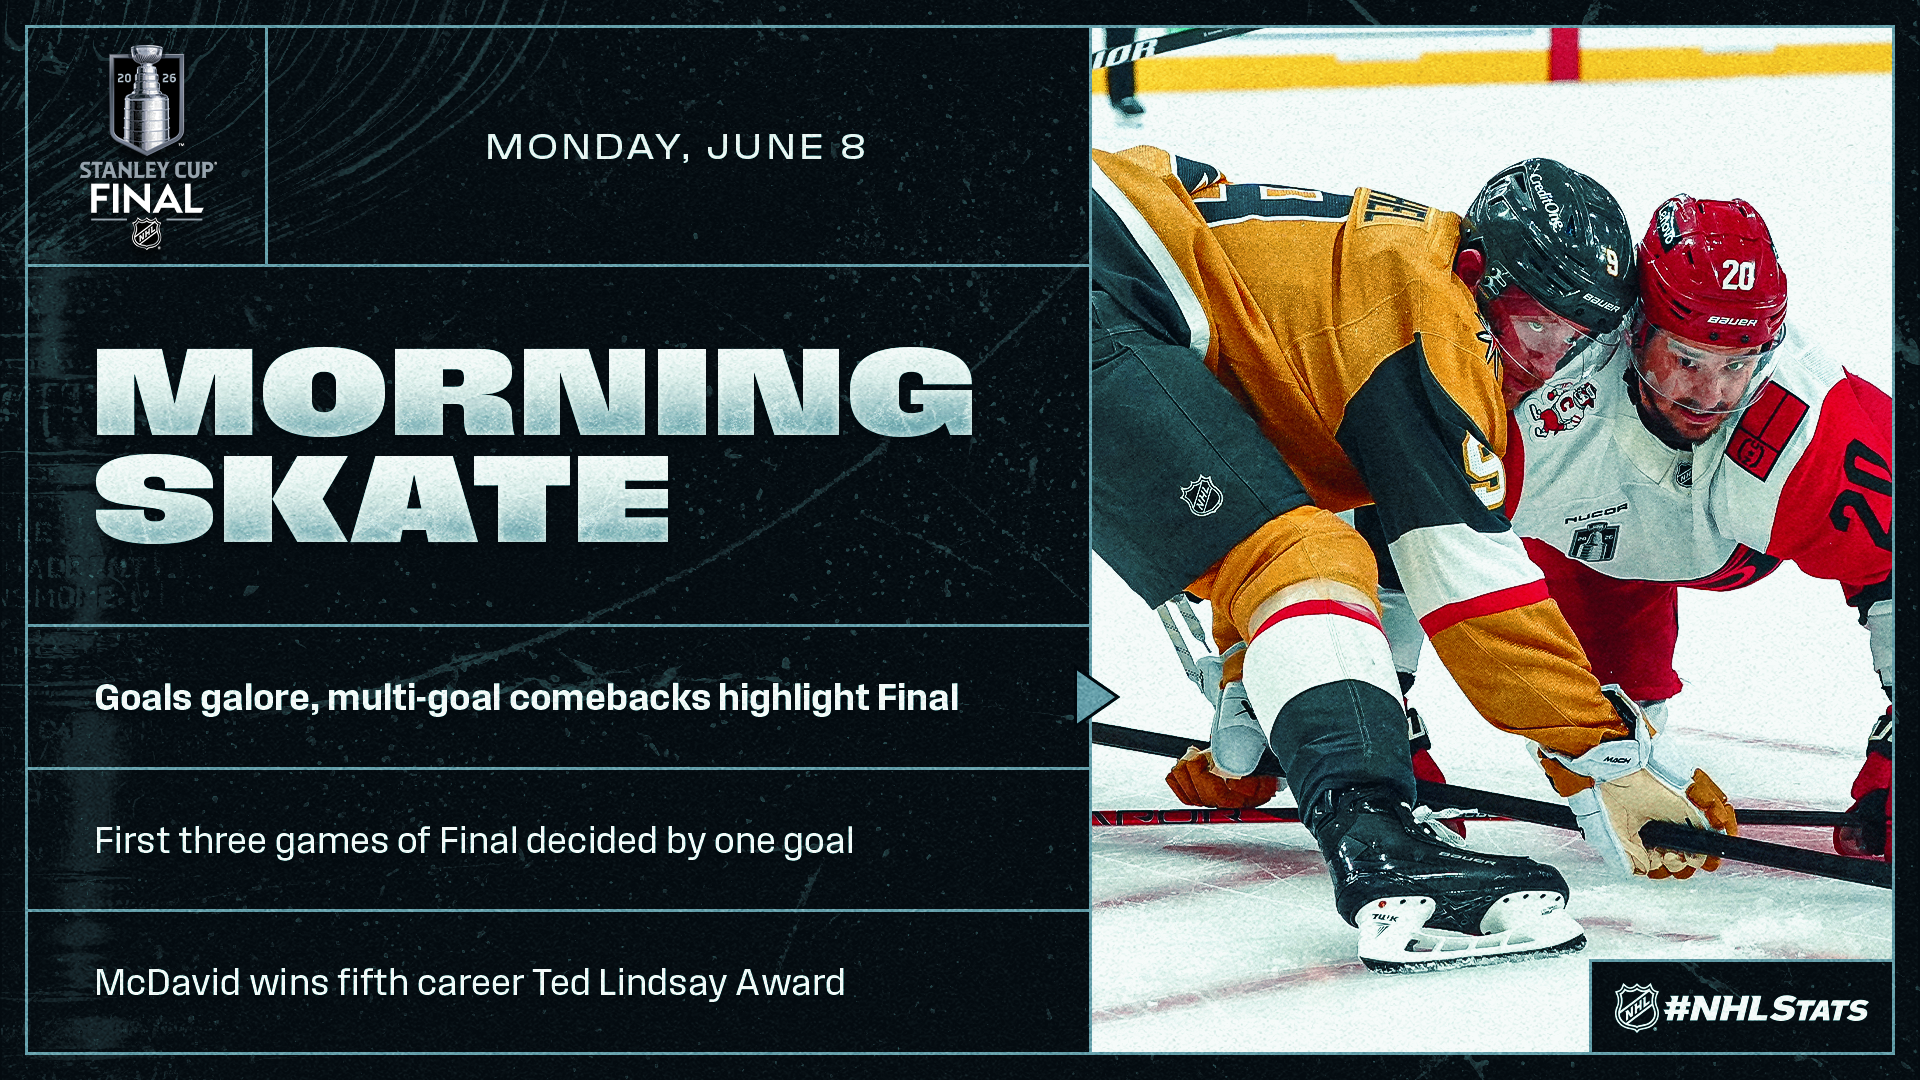
* Close games have been a recurring theme through the first three contests of the 2026 Stanley Cup Final, and the Golden Knights and Hurricanes could combine for just the fourth championship series in NHL history to start with four straight one-goal games.
* Connor McDavid was named the recipient of the Ted Lindsay Award for the fifth time in his career, presented annually to “the most outstanding player in the NHL,” as voted by the members of the NHLPA.
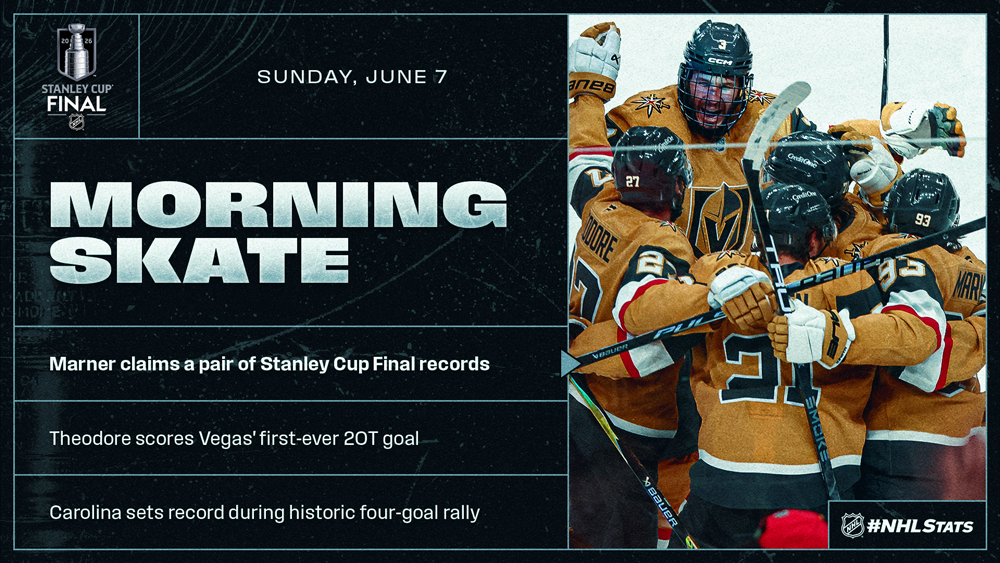
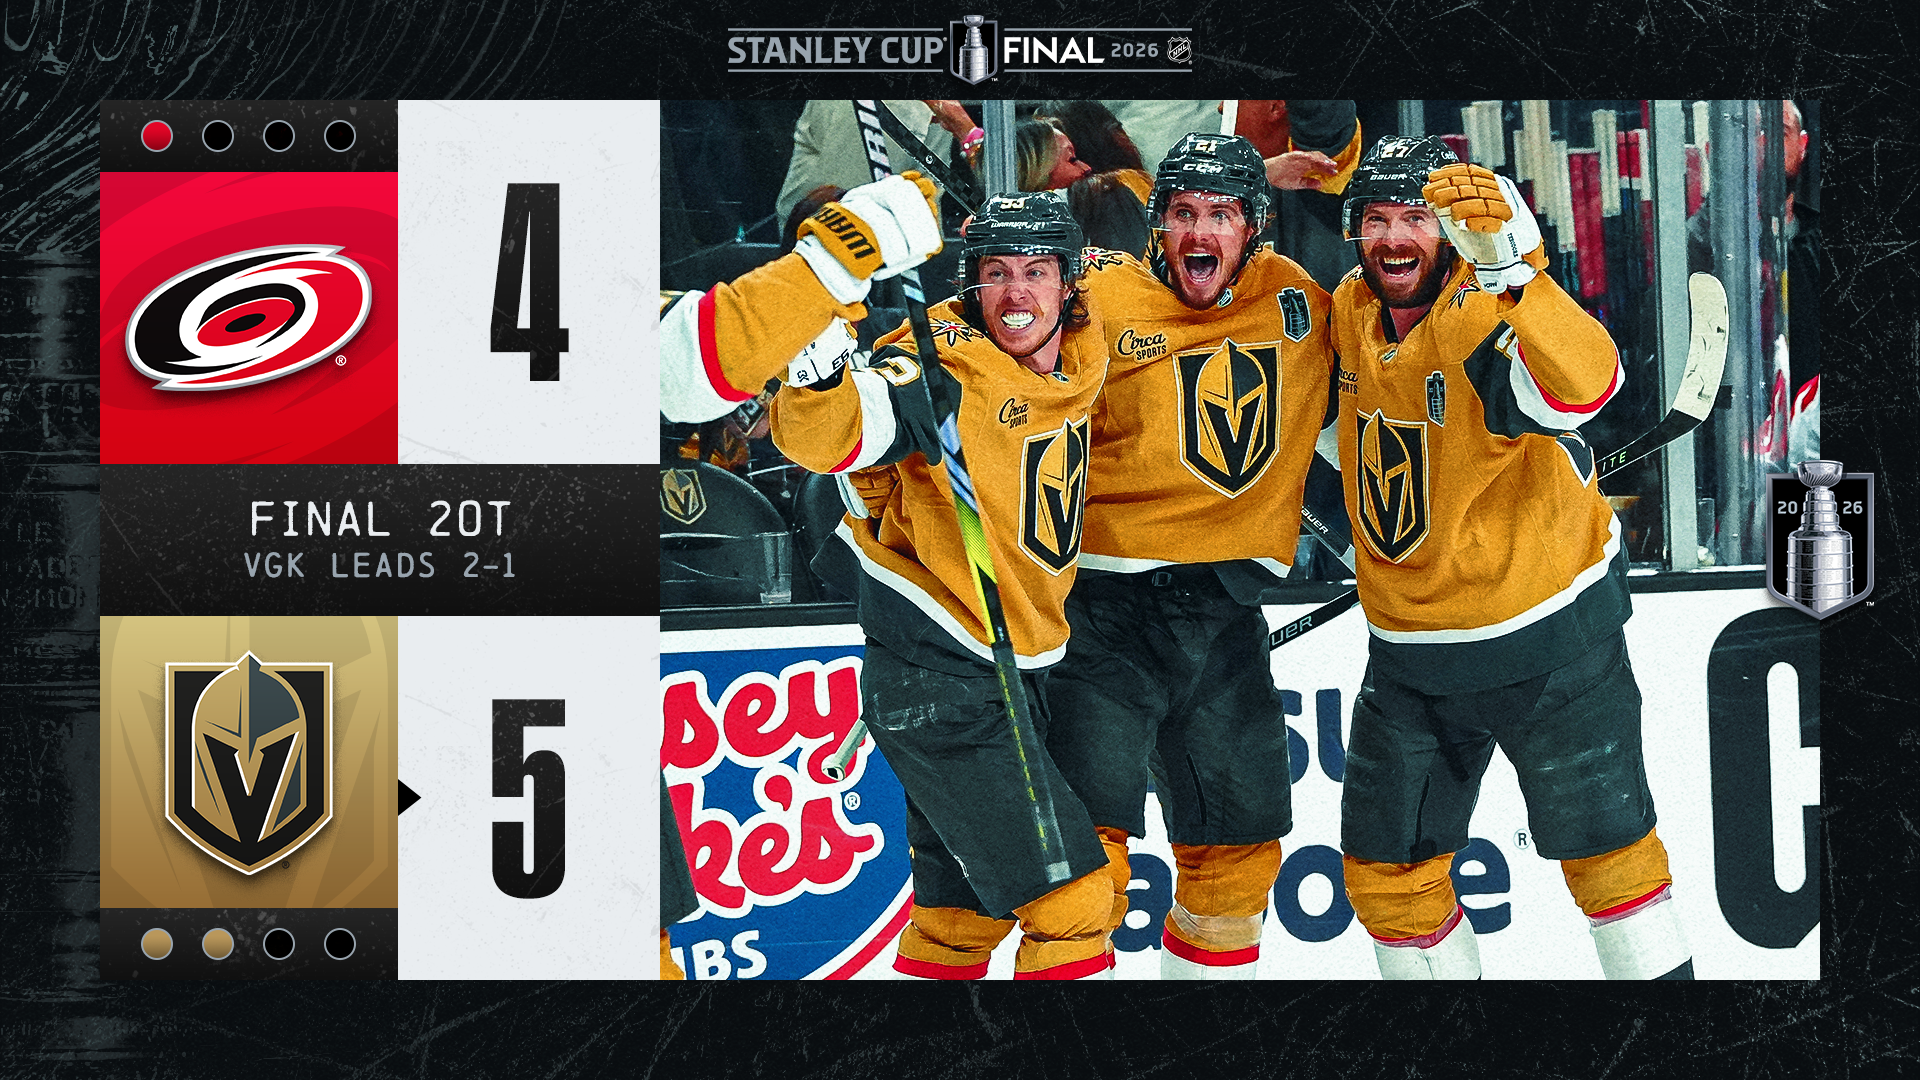
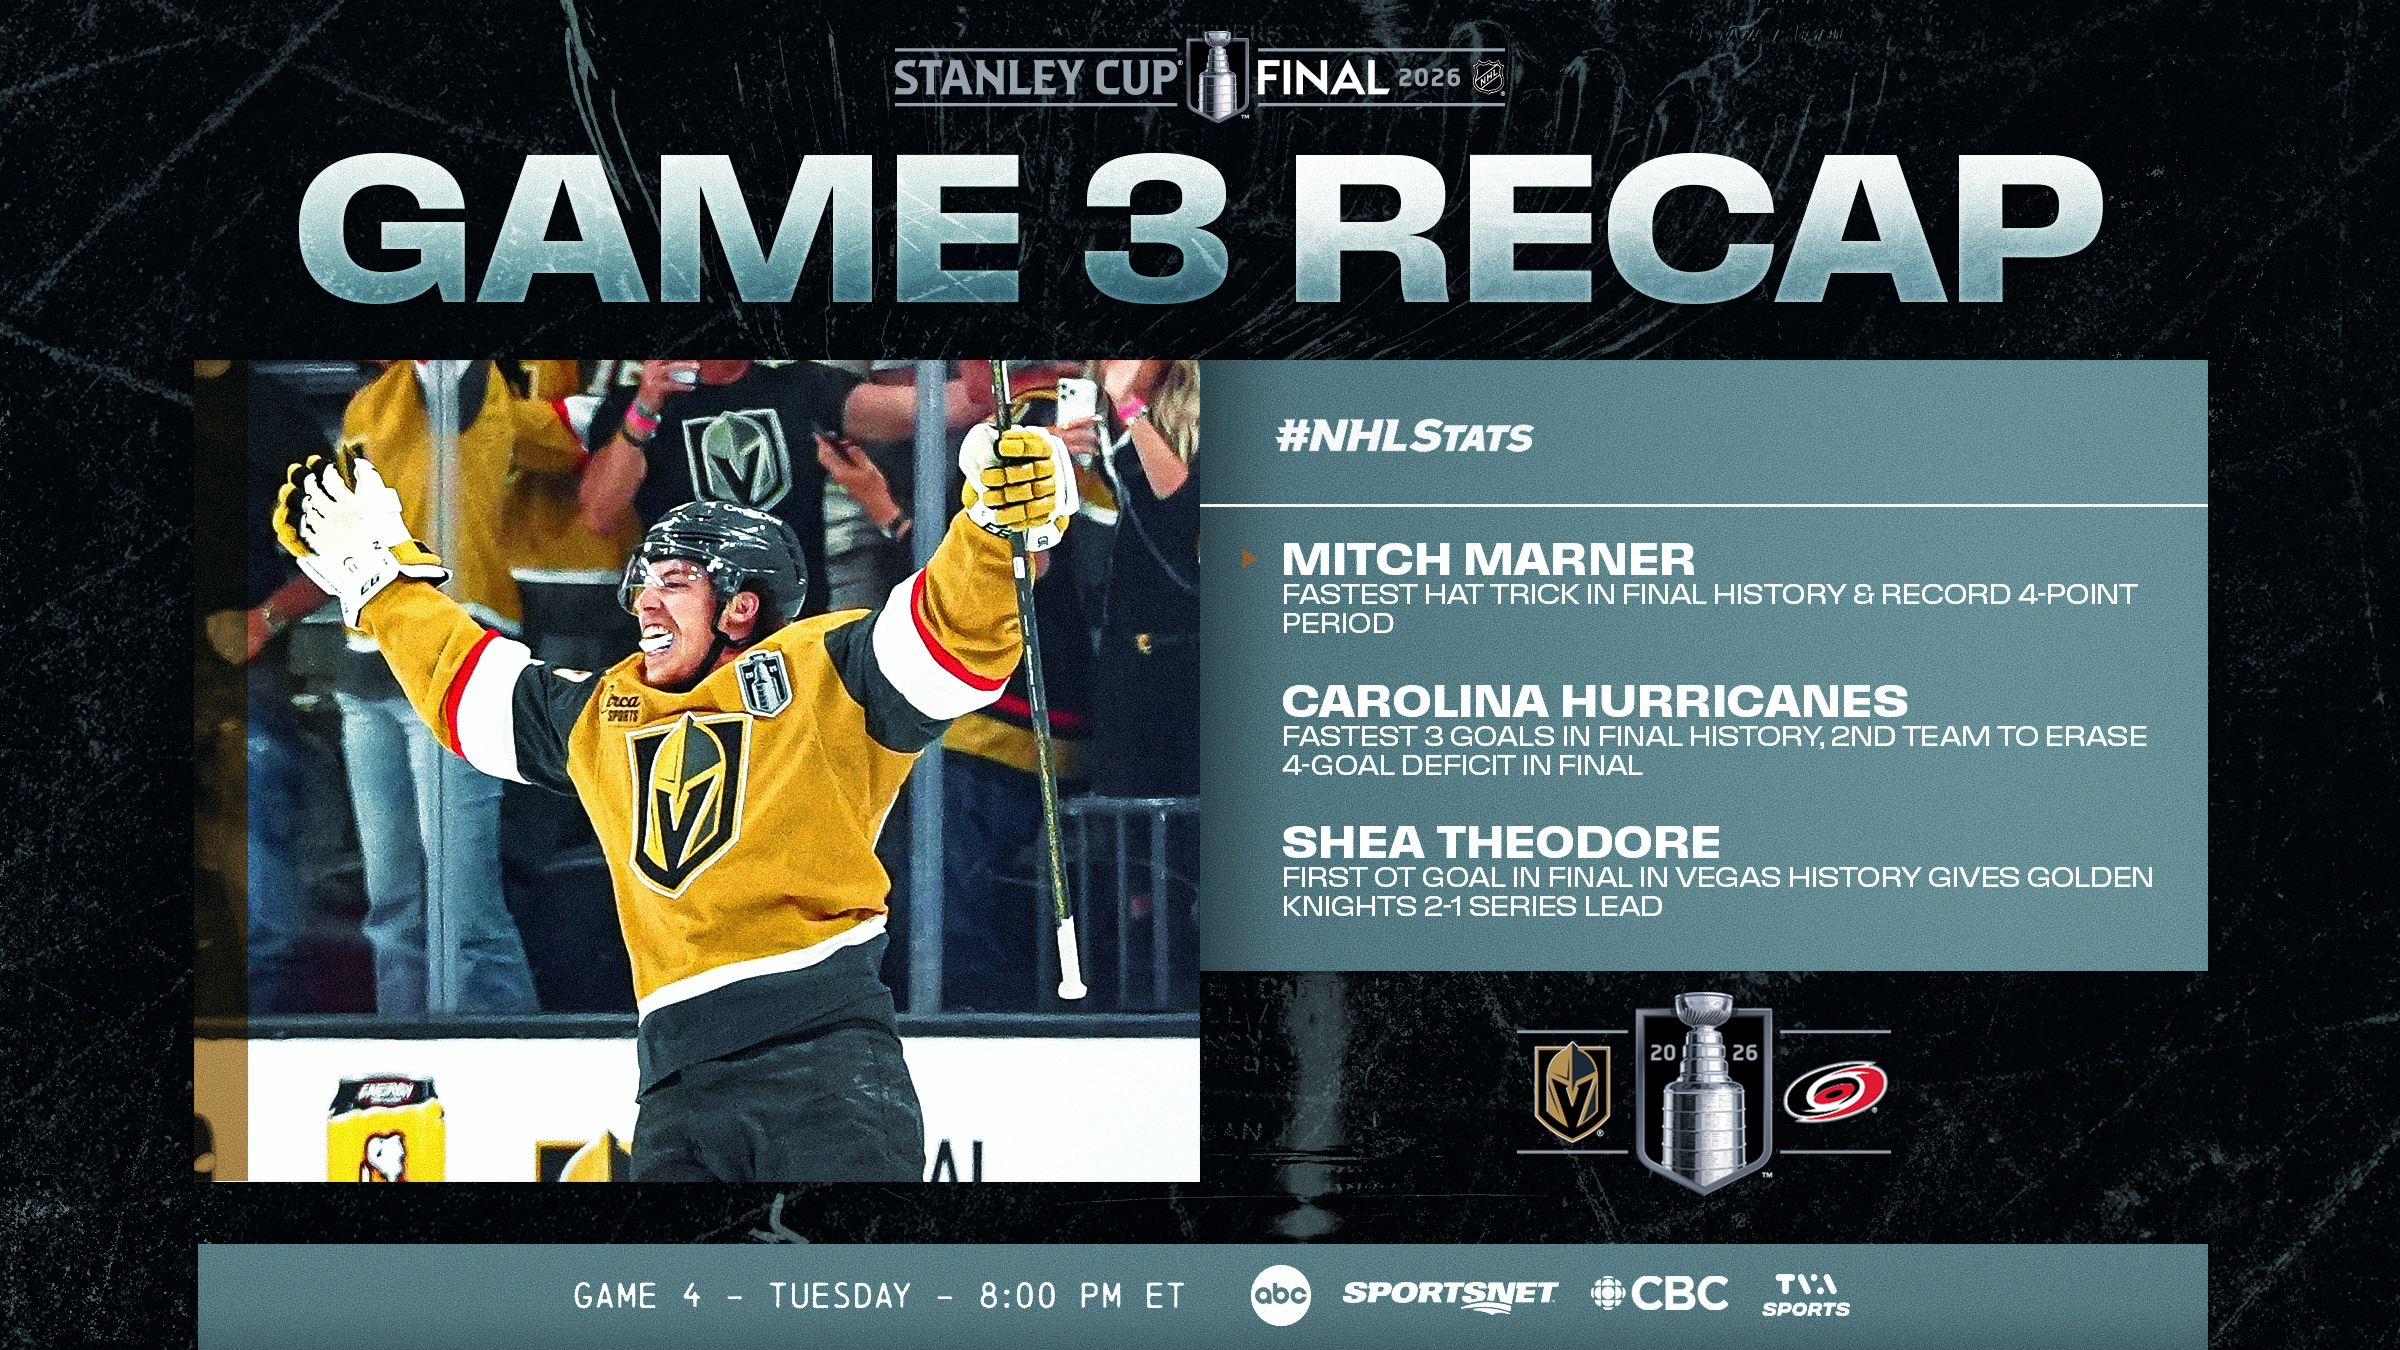
FINAL CONTINUES TO FEATURE GOALS GALORE, COMEBACKS OF ALL KIND The Golden Knights return to T-Mobile Arena for Game 4 of the 2026 Stanley Cup Final on Tuesday with a 2-1 series lead, while the Hurricanes look to equalize on the road in what’s been a thrilling championship round, featuring plenty of scoring as well as a multi-goal comeback win in each of the first two contests plus a four-goal rally by Carolina in Game 3.
* After the Hurricanes and Golden Knights combined to make the 2026 Final the first championship series to feature a multi-goal comeback win by each team through the first two contests, Carolina rewrote NHL history again with a four-goal rally in Game 4. Though they ultimately fell 5-4 in overtime, the Hurricanes became the second team in Stanley Cup Final history to erase a four-goal deficit regardless of result, following Game 1 of the 1972 Final when the Rangers overcame a 5-1 deficit against the Bruins in an eventual 6-5 regulation defeat.
* The 2026 Stanley Cup Final has featured 25 goals through the first three games, the fifth most through that stage of any championship series in NHL history behind 1981 (NYI vs. MNS: 30), 1932 (NYR vs. TOR: 28), 1973 (MTL vs. CHI: 27), 1918 (TAN vs. VMI: 27) and 1980 (PHI vs. NYI: 26). Vegas and Carolina, which have averaged 8.33 goals per game this series, can combine for the fourth Final to feature 33-plus goals through four contests, following the aforementioned 1981 (36), 1918 (36) and 1980 (33) series.
* All three games of the Final have been decided by a one-goal margin, just the 10th championship series in NHL history to feature that trend through the first three contests – and first in a decade (also 3 GP in 2016; PIT vs. SJS). Only three Stanley Cup Finals have started with four straight one-goal games: 2015 (5 GP; CHI vs. TBL), 1951 (5 GP; TOR vs. MTL) and 1968 (4 GP; MTL vs. STL).
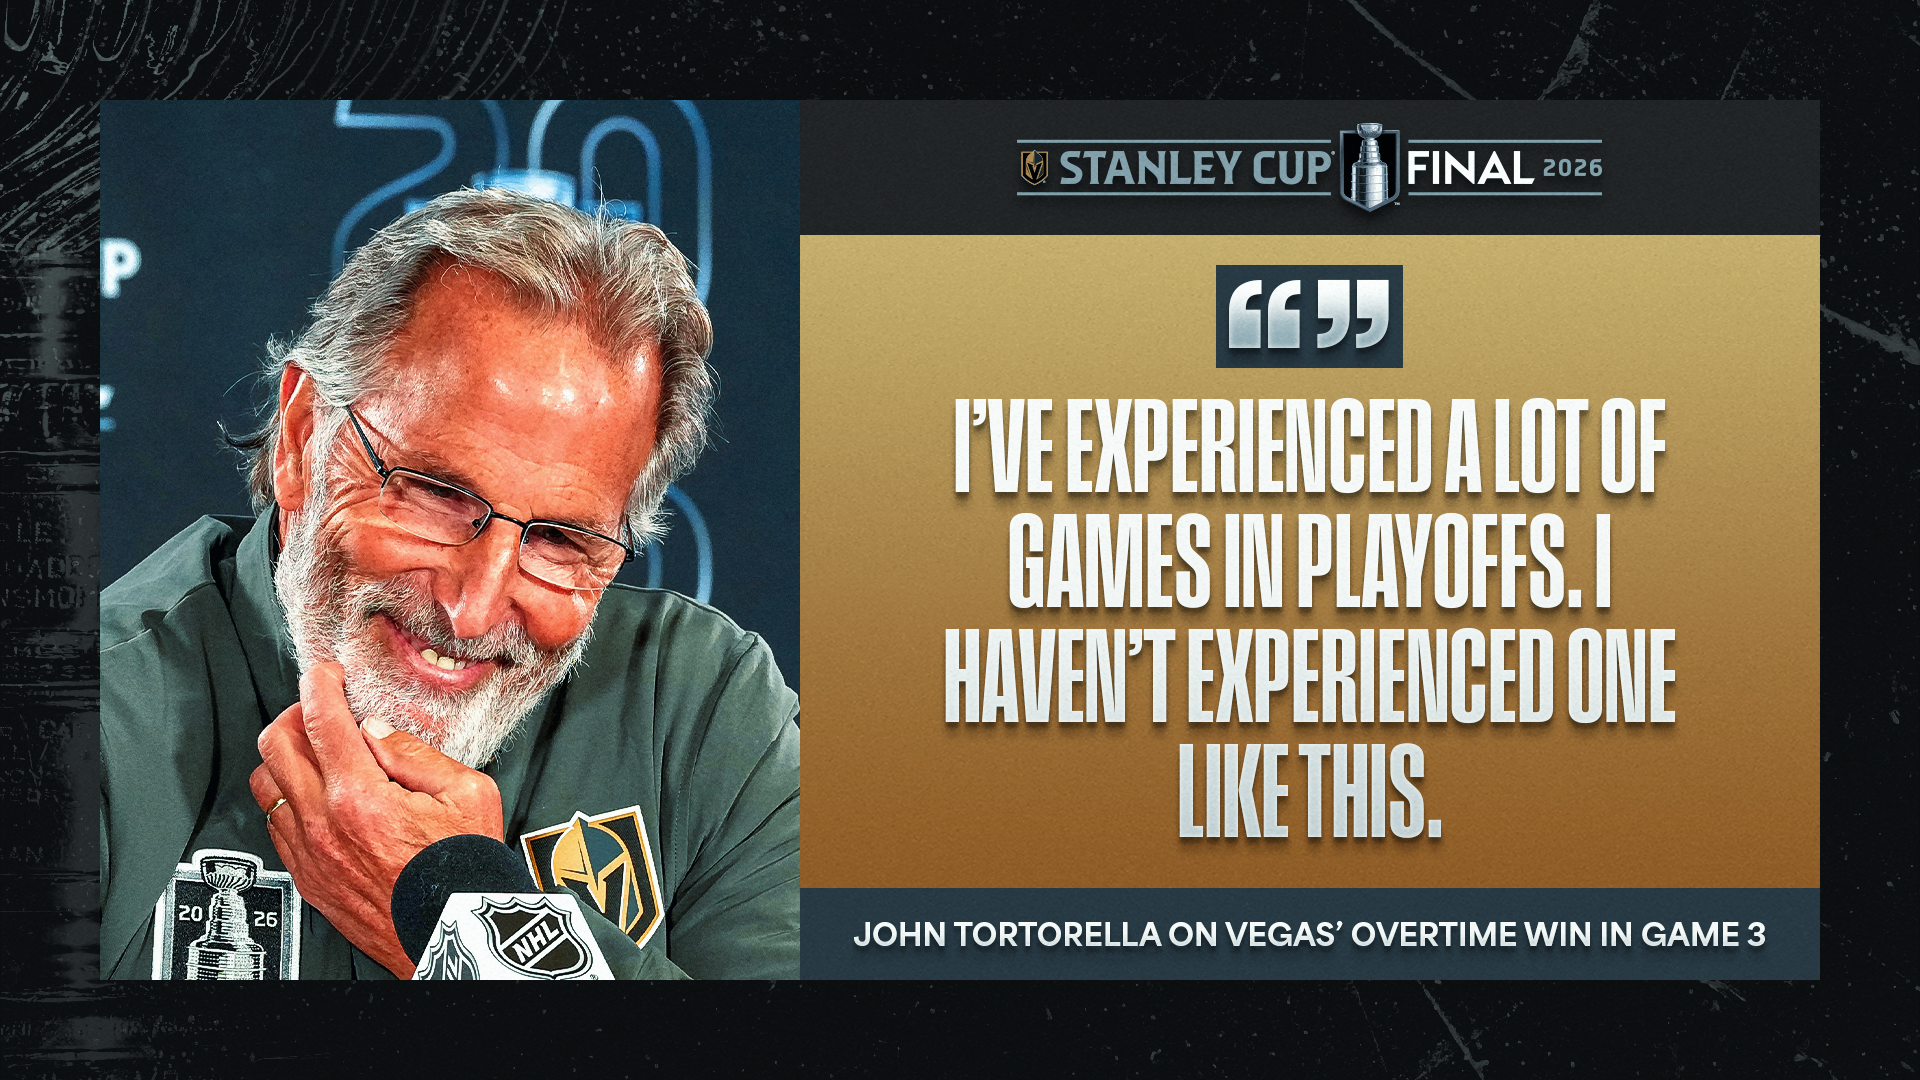
* Shea Theodore scored the overtime winner for Vegas in Game 3 after Seth Jarvis did the same for Carolina in Game 2. Should the teams require extra time again in Game 4, the 2026 Final would mark just the third championship series in NHL history with three straight overtime games, following 1951 (5 GP; MTL vs. TOR) and 1993 (3 GP; LAK vs. MTL).
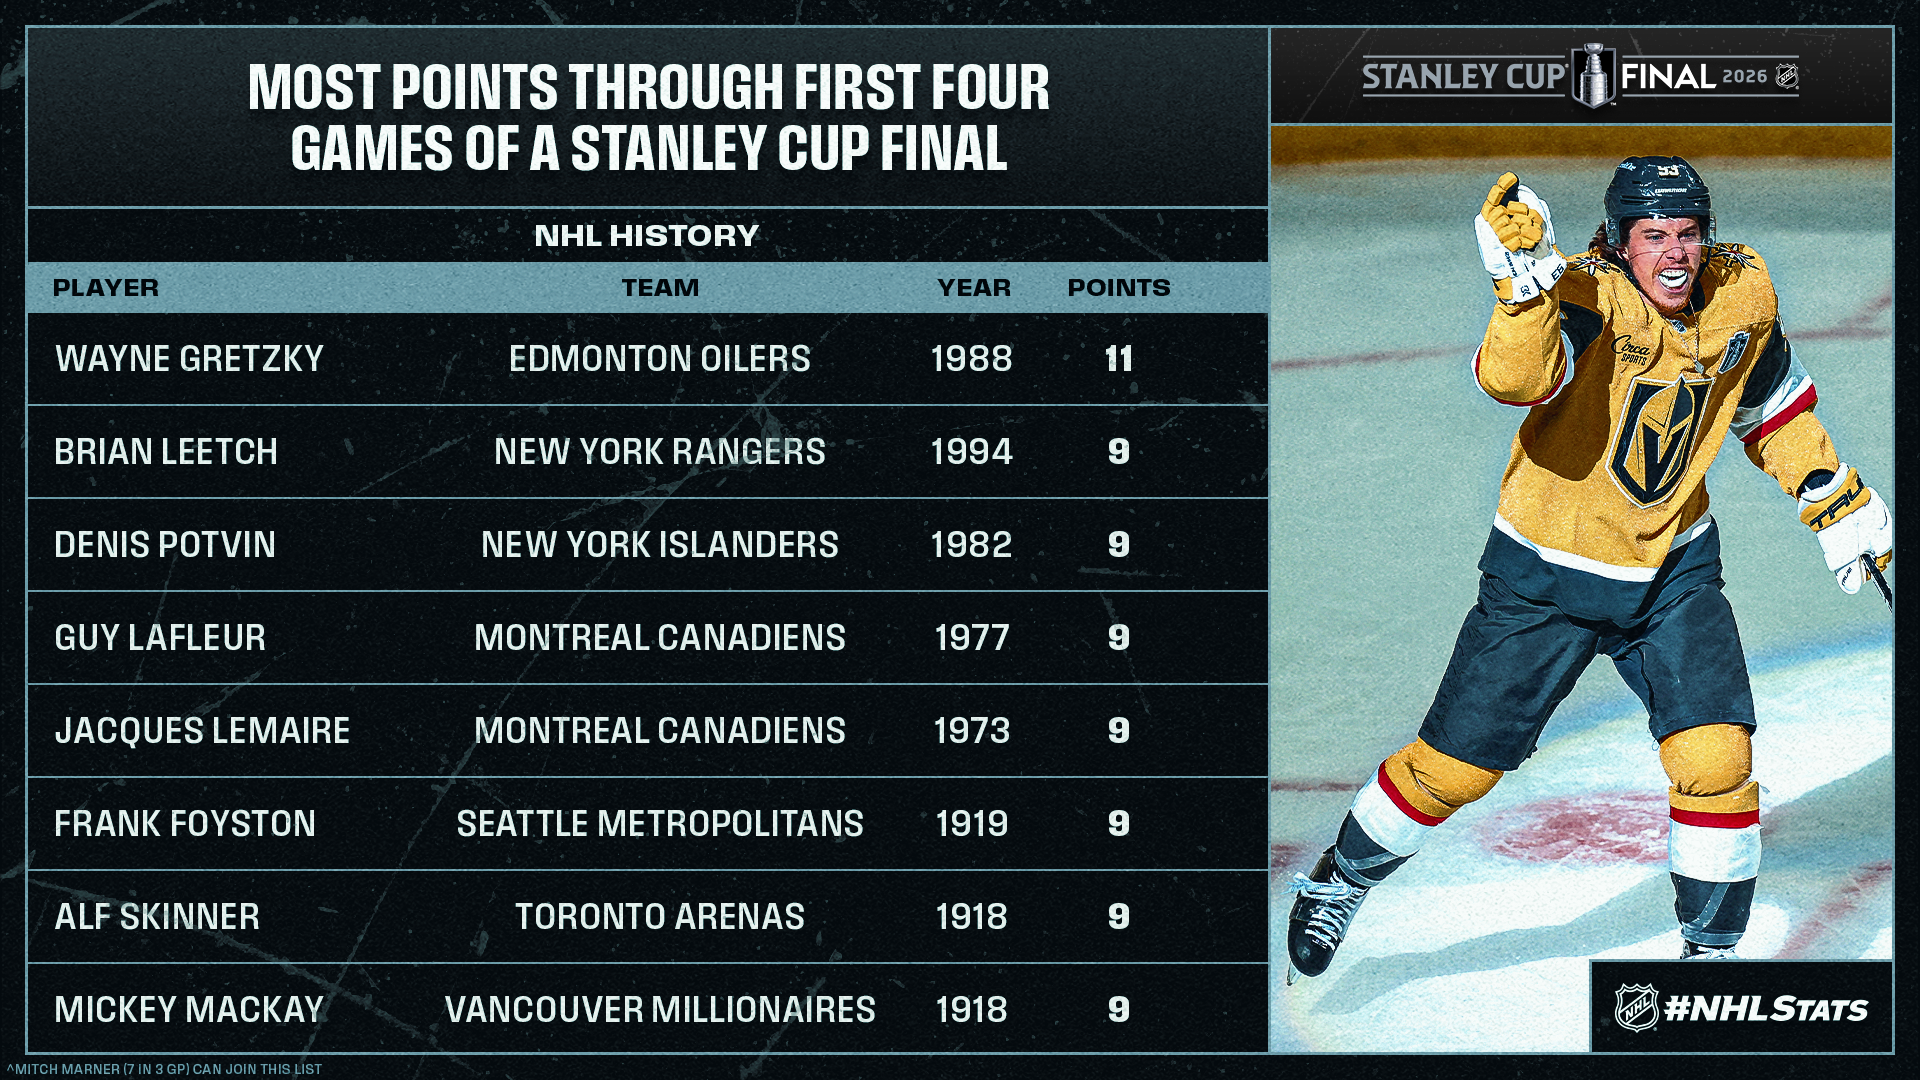
* Mitch Marner netted his second hat trick of the 2026 Stanley Cup Playoffs in Game 3 and leads all skaters in the Final with 3-4—7 (3 GP). Marner will look to join Mikko Rantanen (0-8—8 in 4 GP w/ COL in 2022) as the second player in the past 31 years to record at least eight points through the first four games of a Stanley Cup Final.
* NHL in ASL continues to broadcast every game of the Stanley Cup Final, available for streaming exclusively on the ESPN App for ESPN Unlimited plan subscribers in the U.S. as well as on Sportsnet+ in Canada. The alternate telecast, dedicated completely to the Deaf and hard of hearing community using American Sign Language, captured Theodore’s double-OT winner in Game 3.
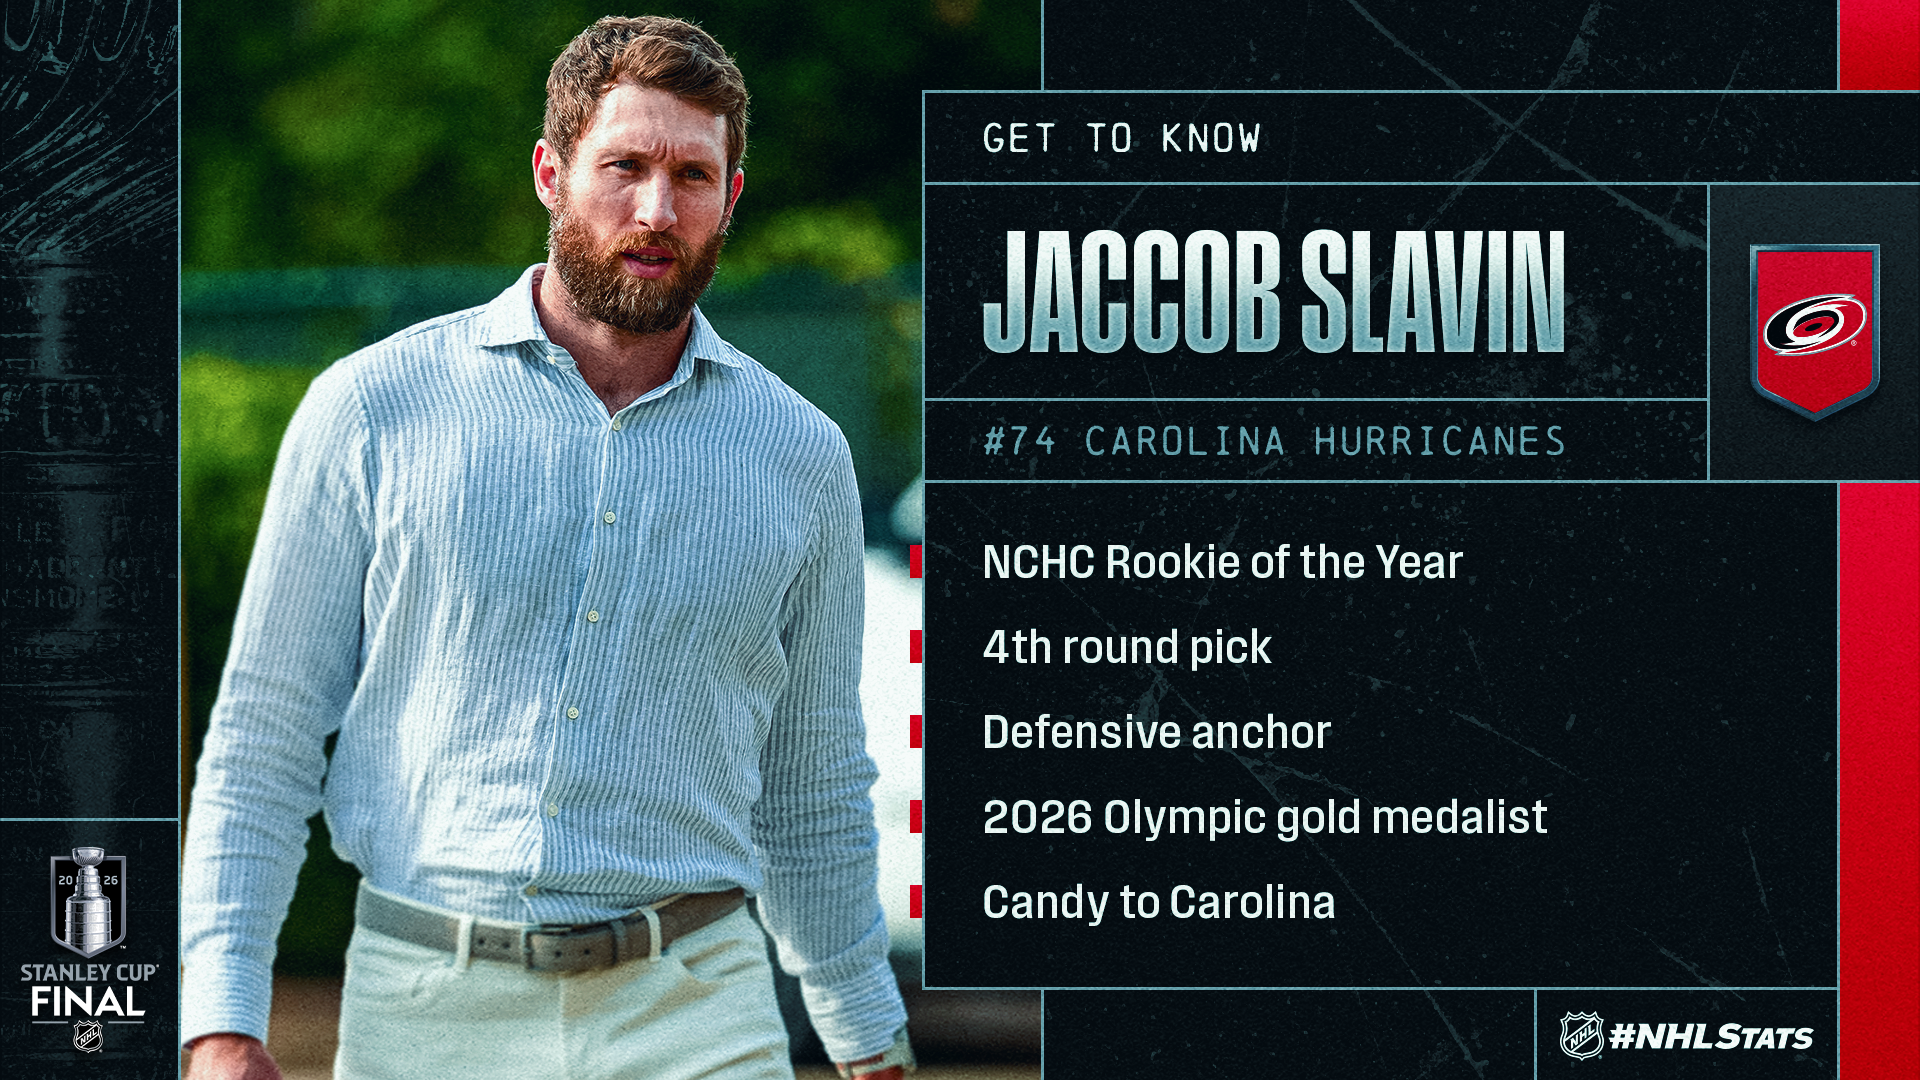
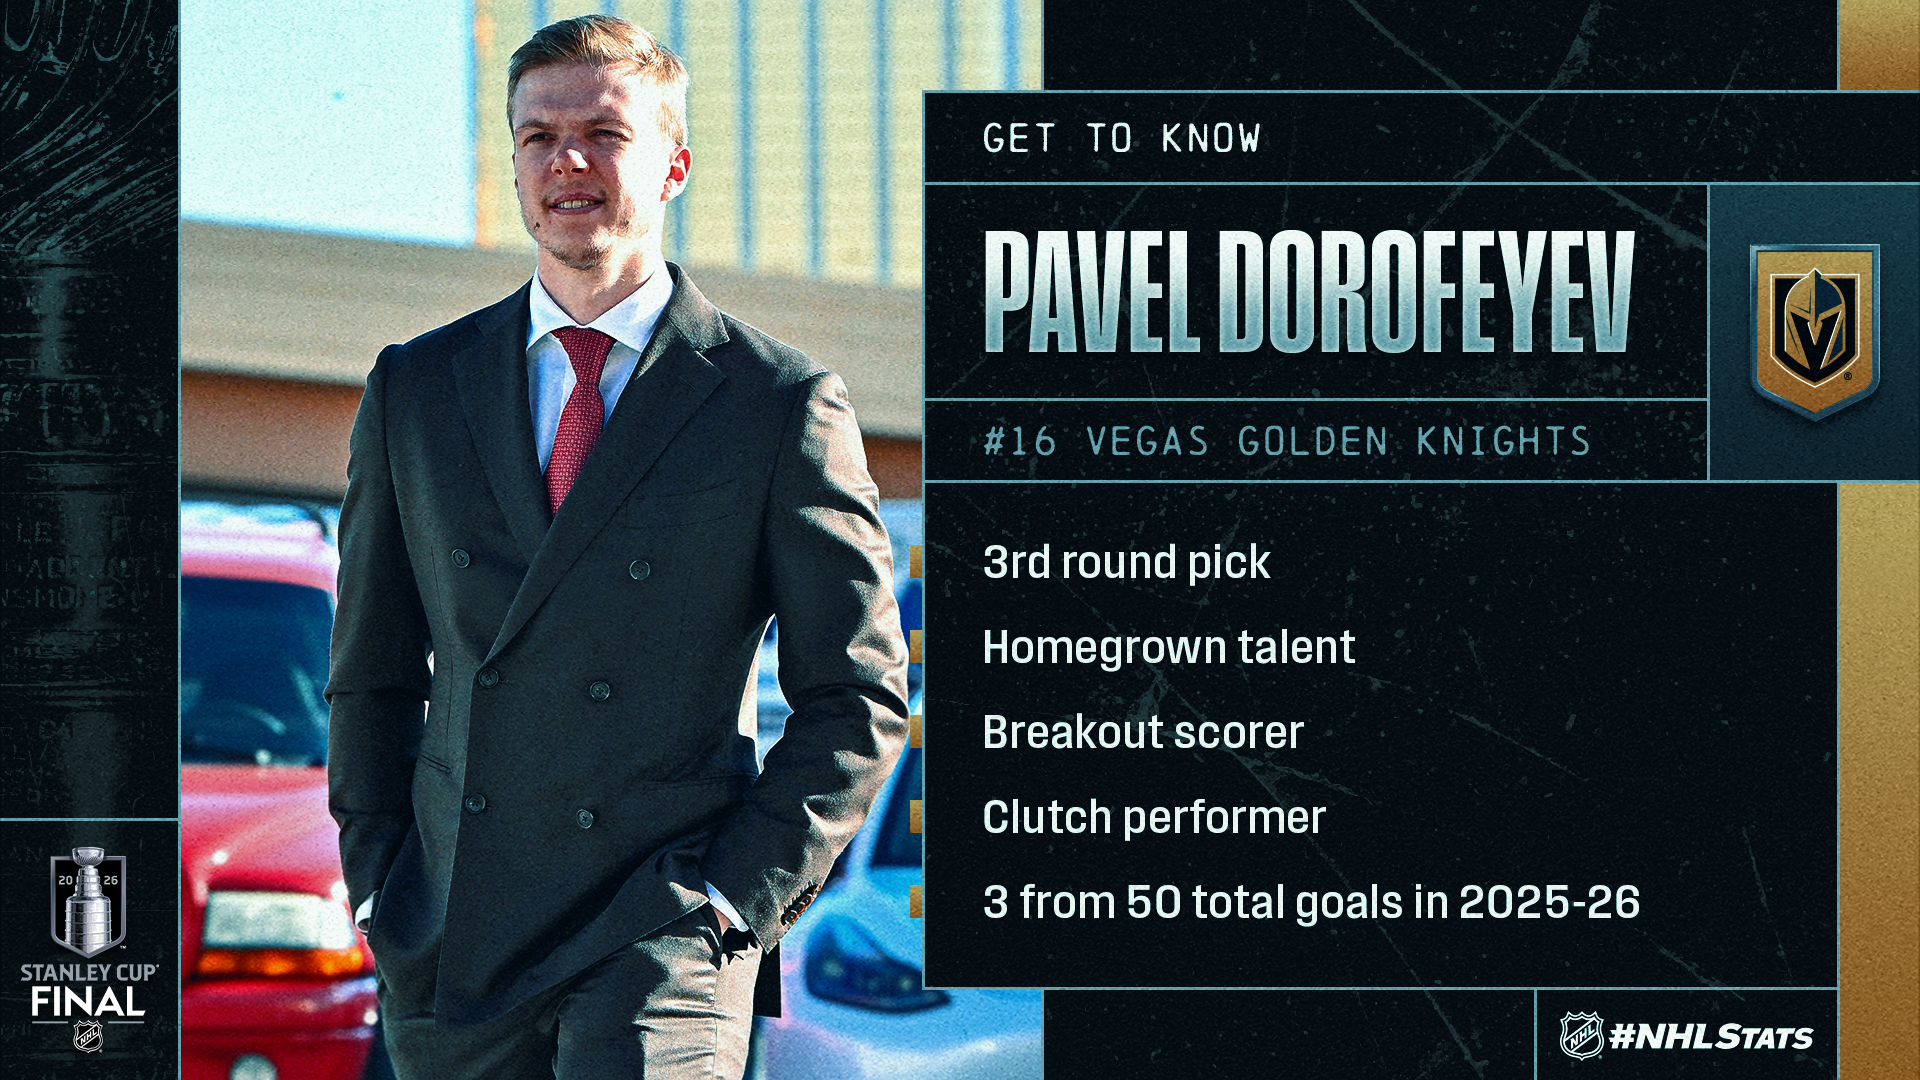
GET TO KNOW: JACCOB SLAVIN AND PAVEL DOROFEYEV A handful of players are appearing in the Stanley Cup Final for the first time in their careers in 2026 as Vegas and Carolina each continue to chase their second-ever championship. Hurricanes defenseman JaccobSlavin and Golden Knights forward PavelDorofeyev are two of those stars looking to hoist the Cup by the end of June.
* Slavin’s career highlights include franchise playoff records for goals, assists and points by a defenseman (9-35—44 in 102 GP), two Lady Byng Trophies and the distinction of being the only active blueliner to register 40 or more playoff points and a plus-40 rating. Only one other defenseman in League history has captured the Lady Byng Trophy multiple times: RedKelly (3x)
* He has found the score sheet in two of three games to start the Stanley Cup Final (0-2—2 in 3 GP) and has done so on the heels of capturing a gold medal with the United States at the Olympic Winter Games Milano Cortina 2026. He can join DrewDoughty (2013-14), DuncanKeith (2009-10), BrentSeabrook (2009-10) and KenMorrow (1979-80) as the fifth defenseman to win an Olympic gold medal and Stanley Cup in the same season.
* Slavin started skating at age two using an M&M’s candy method his parents developed, where his mom, Wendi, would place M&M’s candies on the ice in small intervals to encourage him – and all of his siblings – to learn to skate. He has two children and has since bought M&M’s in bulk as both have learned to skate the Slavin way.
* Dorofeyev (No. 79 in 2019) is one of two players on Vegas’ roster that was drafted by the franchise, alongside KaedanKorczak (No. 41 in 2019), who has yet to skate in a game during this championship series. Vegas, which won its first Cup in 2023 with just one player drafted by the club having competed in the Final (min. 1 GP), can become the fourth franchise in NHL history to achieve the feat multiple times, following Montreal (5x), Toronto (2x) and Boston (2x).
* He has found the back of the net for the Golden Knights when it matters most in the 2026 Stanley Cup Playoffs – with five of his 10 goals this postseason having tied the contest. Dorofeyev is looking for his first points of the Final when the puck drops at T-Mobile Arena for Game 4 and should he help Vegas draw even once again, he would join LucRobitaille (7 in 1991), JoePavelski (6 in 2020) and JereLehtinen (6 in 1999) as the fourth player in Stanley Cup Playoffs history with six or more game-tying goals in a single playoff year.
* The 2026 Stanley Cup Final culminates a career season for the 25-year-old forward where he established a career high with 37 goals – highlighted by a hat trick on opening night against the Kings. He has made a habit of making hats fly this year after also securing a three-goal performance in Game 5 of the First Round. Now, Dorofeyev (47 in 101 GP) needs three more goals to join William Karlsson (50 in 2017-18) as the second Golden Knights player with 50 in one campaign (regular season & playoffs combined).
McDAVID WINS FIFTH TED LINDSAY AWARD Connor McDavid was named as the recipient of the Ted Lindsay Award on Sunday, presented annually to “the most outstanding player in the NHL,” as voted by the members of the NHLPA. The Oilers captain was surprised with the trophy by his family and close friends during a casual golf outing.
* McDavid became just the second five-time recipient in the award’s history, following Wayne Gretzky. McDavid was also named the recipient in 2016-17, 2017-18, 2020-21 and 2022-23.
* McDavid’s 16 overall individual awards are the fourth most by any player in NHL history, behind Gretzky (31), Alex Ovechkin (19), Bobby Orr (17) and Mario Lemieux (17).
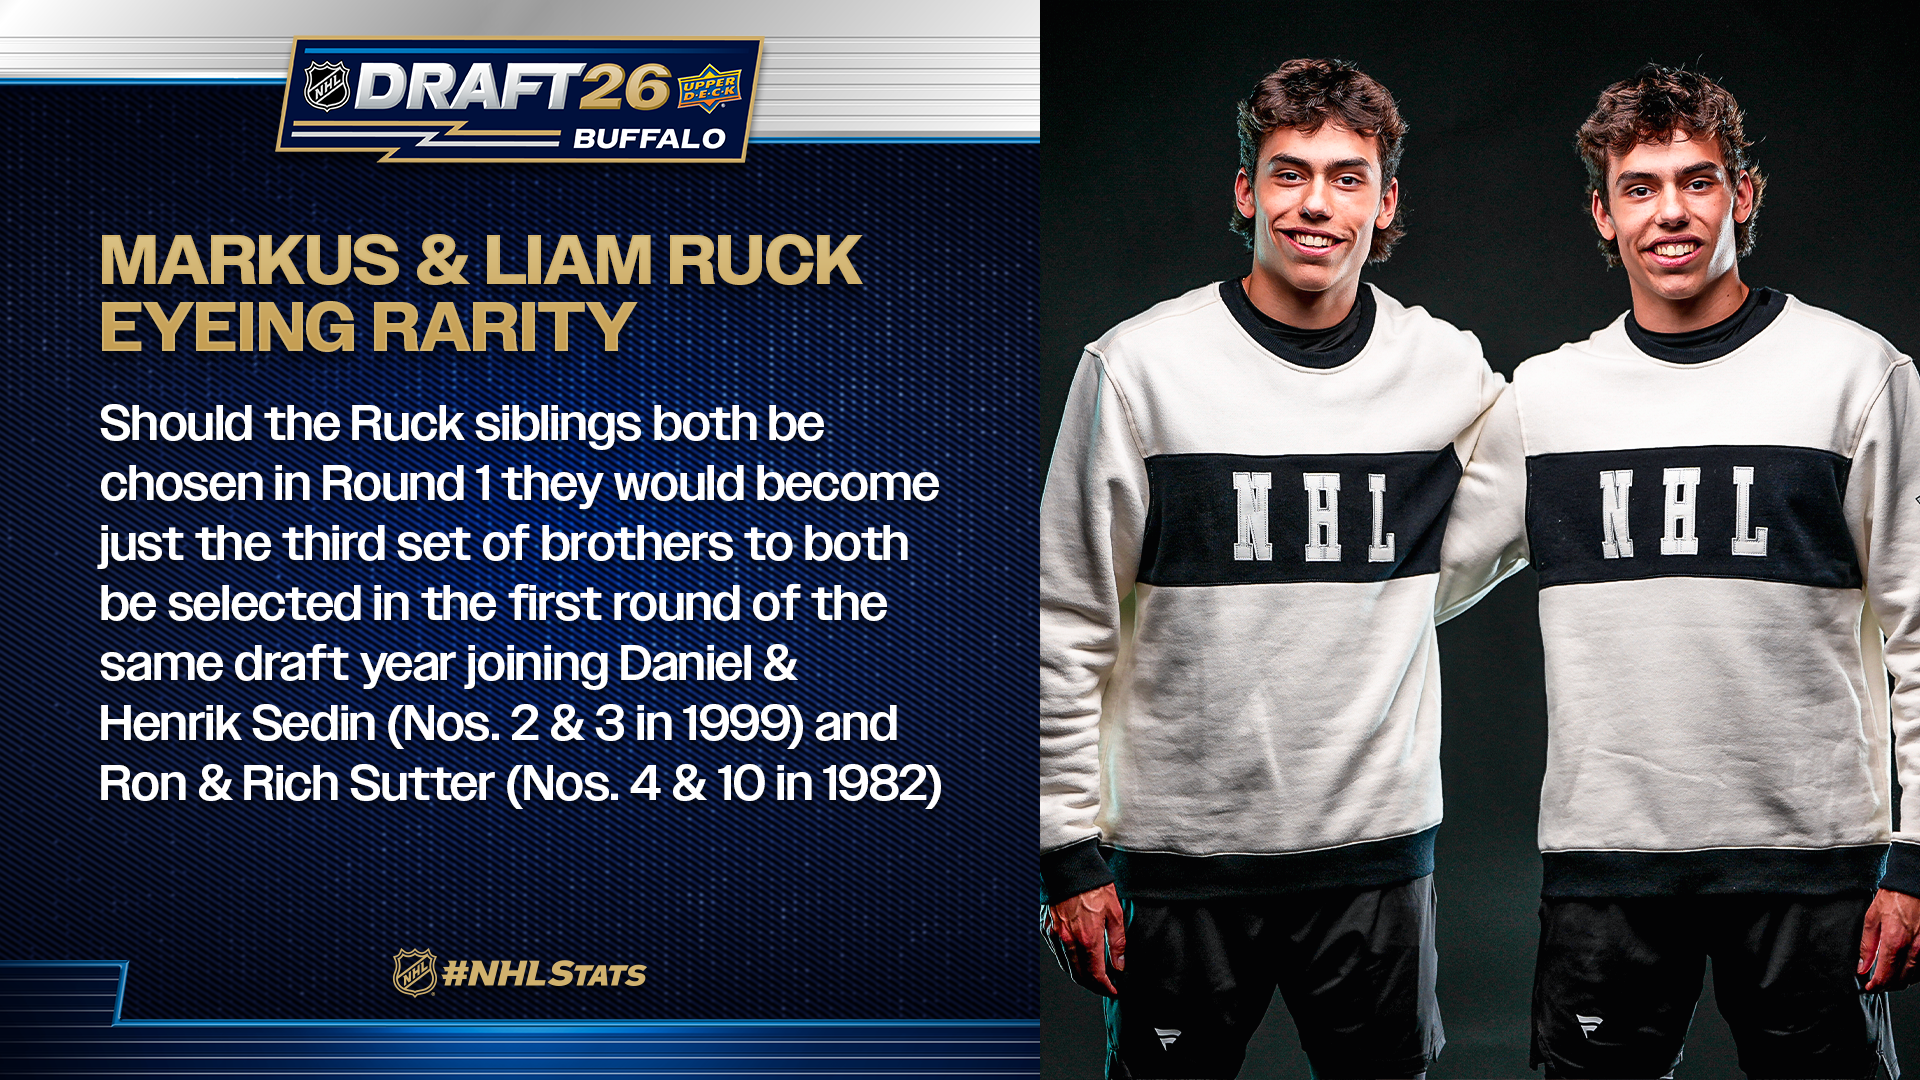
LOOKING AHEAD TO THE DRAFT: SET OF TWINS TO WATCH FOR IN RUCK BROTHERS
Liam Ruck (No. 20-Ranked North American Skater) and Markus Ruck (No. 23-Ranked North American Skater) are twins and teammates in the WHL with the Medicine Hat Tigers, both who will hope to hear their name called in Buffalo at the 2026 Upper Deck NHL Draft. The pair are mirror twins – which is when a pair of twins possess opposite traits that mirror each other – who were born eight minutes apart and have been inseparable ever since. They joined “NHL Draft Class” podcast this week from the NHL Scouting Combine.
* Markus (21-87—108 in 68 GP) and Liam (45-59—104 in 68 GP) finished first and second in WHL scoring during the 2025-26 regular season and won a WHL championship together in 2024-25. The duo is from Osoyoos, B.C., and grew up big Canucks fans, even having their childhood room painted in Canucks colors. They hope to follow in the Sedin twins’ footsteps by both being selected in the first round of the NHL Draft and maybe even playing together on an NHL team.
* CLICK HERE for #NHLStats Pack: Looking Ahead to the 2026 Upper Deck NHL Draft
* History was made at both ends of the ice in Game 3 of an already-unmatched championship series as MitchMarner scored the fastest hat trick in Stanley Cup Final history – part of a record-setting four-point period – before the Hurricanes responded with a record-setting achievement and four-goal rally.
* All that history set up a memorable finish for the hosts, who claimed their first-ever Stanley Cup Final overtime win on the strength of a double-overtime goal by original “Golden Misfit” Shea Theodore, with an assist to another original Golden Knight in Brayden McNabb (who played 35:47 in his return to the lineup following a Game 2 injury, second to only Theodore).
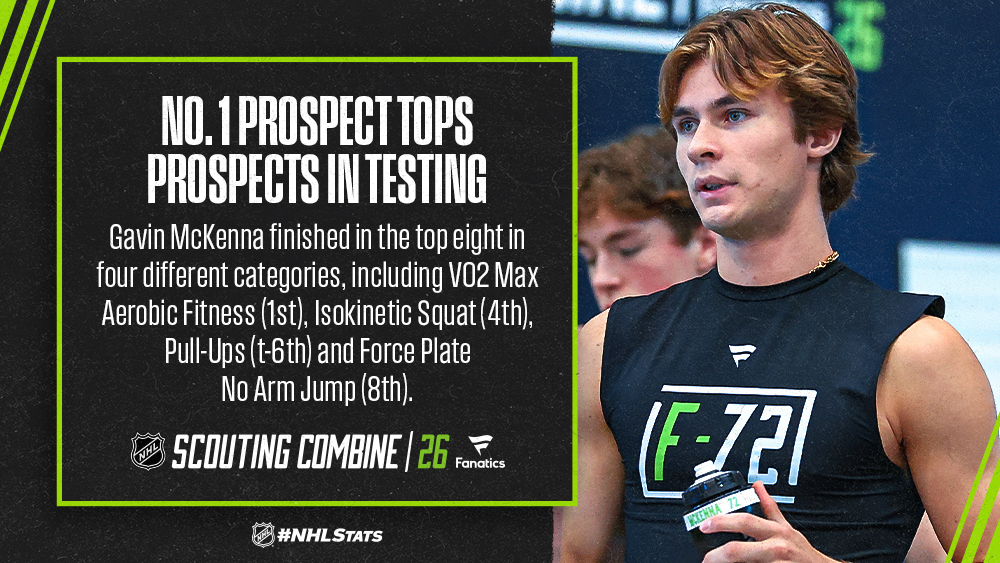
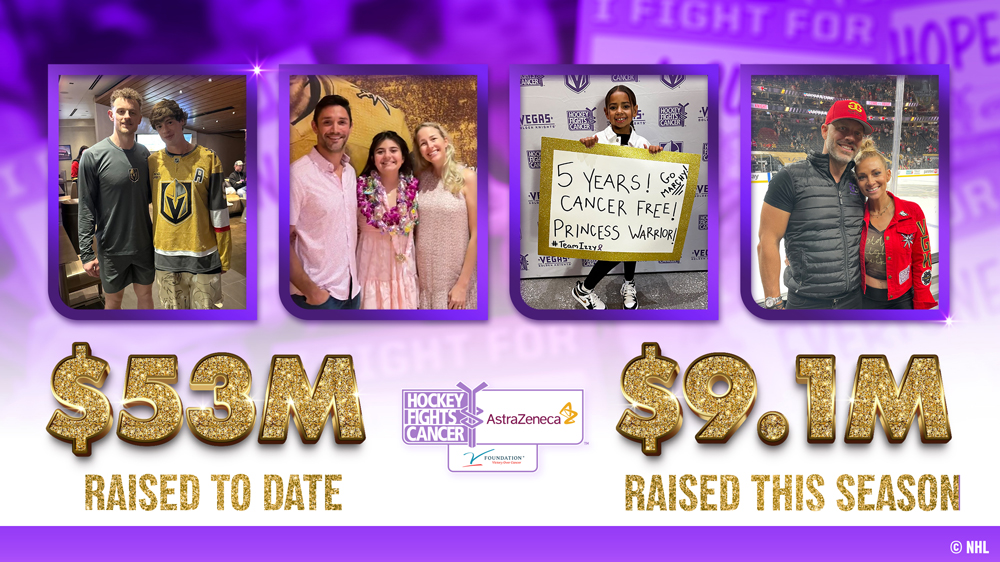
* It was a newsworthy day on many other fronts around the NHL as Gavin McKenna and 89 other draft-eligible players completed the2026 NHL Scouting Combine presented by Fanatics; it was announced that Hockey Fights Cancer has eclipsed a total of $53 million in fundraising (including over $9.1 million in 2025-26); and two NHL Awards were handed out including the Vezina Trophy (under suspicious circumstances).
WHAT MADE GAME 3 HISTORIC
* MitchMarner (3-1—4) scored the fastest hat trick in Stanley Cup Final history (6:10) – besting the previous mark of 6:21 set 69 years ago by MauriceRichard – and became the first NHL player with four points in a period during the Stanley Cup Final. In the process, Marner also set a franchise record for points in a playoff year and broke Frank Mahovlich’s mark (27 in 1971 w/ MTL) for playoff points by a player in his first season with a franchise. Marner, who also attempted a penalty shot, has a long list of notes in #NHLStats: Live Updates.
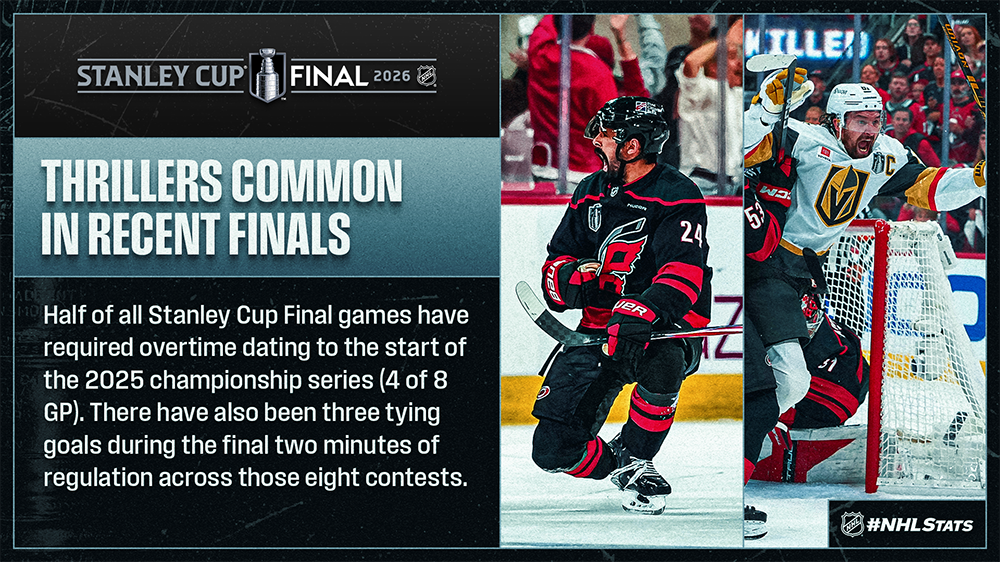
* Staal and SebastianAho (0-2—2) – who recorded his eighth consecutive 10-point postseason – then combined on Carolina’s tying goal with 1:42 remaining in regulation and helped their club become the second team in Stanley Cup Final history to erase a deficit of four or more goals, regardless of result. Overall, this is the second time in Stanley Cup Final history that there has been a tying goal in the final two minutes of regulation in consecutive games (also MarkStone in Game 2 at 58:39). Every game in this series has now seen a tying goal in the last 10 minutes of regulation – a first in Stanley Cup Final history.
A STANLEY CUP FINAL GAME TO CHALLENGE ANY KNIGHT’S TALE
For 78 minutes of real time, Game 3 of the Stanley Cup Final was deadlocked at zeros but that changed in a hurry – and the historic nature of this matchup quickly returned as Vegas turned the game on its head with a four-goal outburst and, in true Vegas style, the visitors followed suit with four of their own in the third period to tie the game. As Vegas luck would have it, 78 minutes after the game-tying goal, the home team iced a Game 3 victory with a double-overtime winner by defenseman Shea Theodore.
5:23 p.m. PT – Puck drop of Game 3 * The puck drops on the first Stanley Cup Final game in Vegas since their 9-3 Cup-clincher in 2023, but the Hurricanes hold the Golden Knights to only two shots on goal in the opening 20 minutes of play.
6:41 p.m. PT – Game 3 is still tied at 0-0
* A TV timeout shows zeros on the scoreboard for both teams, but the Vegas crowd is seconds away from eruption with Tomas Hertl winning the ensuing face-off to set in motion a sequence of events unlike any the NHL has ever seen.
6:42 p.m. PT – Hertl scores the opening goal for Vegas
* Hertl notched his fourth go-ahead goal of the playoffs with MitchMarner recording his first point of the night, moving within one of tying the franchise record for most in a playoff year.
6:57 p.m. PT – Marner collects his fourth point with a hat-trick goal, Vegas takes 4-0 lead
* Marner completed the fastest hat trick in Stanley Cup Final history and gave the Golden Knights a four-goal lead just 15 minutes after the club’s opening goal (6:26 in game time).
7:33 p.m. PT – Jordan Martinook scores Carolina’s first goal of the night
* The Hurricanes began yet another rally as Martinook triggers what turns out to be the third straight game of this series with a multi-goal rally.
7:37 p.m. PT – Jordan Staal cuts Carolina’s deficit to one
* Less than five minutes after Martinook’s goal, Staal pulled his team within one to complete the fastest three goals by one team in Final history (0:39 of game time) and become the second 37-year-old in NHL history to start a Final with a three-game goal streak.
8:05 p.m. PT – Andrei Svechnikov ties the game
* Carolina became the second team in Stanley Cup Final history to erase a four-goal deficit and first in more than 50 years. In Game 1 of the 1972 Stanley Cup Final, the Rangers trailed 5-1 before tying the score in an eventual 6-5 regulation defeat against the Bruins.
9:23 p.m. PT – Shea Theodore scores the OT winner for Vegas
* Theodore became the seventh defenseman in NHL history with multiple overtime goals in a single postseason and the only active blueliner with multiple career playoff OT winners (his other was in Game 4 of the First Round this year at Utah).
RECAPPING A BUSY SATURDAY AROUND THE NHL
Saturday was a newsworthy day across the NHL on many fronts:
* The 2026 NHL Scouting Combine presented by Fanatics, which included 90 draft-eligible players from North America and Europe, concluded Saturday with final fitness testing in Buffalo. Gavin McKenna, the top-ranked North American skater, topped the prospects in the VO2 Max Aerobic Fitness and ranked among the top eight in three other categories. Click here for the top 25 results from each test.
* The NHL, NHLPA and the V Foundation for Cancer Research announced that over $9.1 million was raised during the 2025-26 season for Hockey Fights Cancer powered by the V Foundation presented by AstraZeneca. Since its founding in 1998, Hockey Fights Cancer has eclipsed a total of $53 million in fundraising. The announcement was followed by three special moments during Game 3 in recognition of National Cancer Survivor Month: four survivors, Isabella “Izzy” Woodward (age 11), Gabrie Nakhle (age 14), Cooper Petrone (age 25) and Krystal Galindo (age 40) served as “March Marshalls” leading fans into T-Mobile Arena; all four were then recognized in-arena during the first period; and Petrone returned during the second intermission, participating in the “Knight Club” experience.
* NHL Commissioner Gary Bettman joined the NHL in ASL telecast to discuss the Hockey Fights Cancer announcement, which includes over $4.8 million from this season’s campaign to support lifesaving cancer research across NHL markets in North America in partnership with the V Foundation. Across North America, individual NHL Clubs raised more than $3.2 million for local cancer-related charities. The American Cancer Society and Canadian Cancer Society also raised more than $1 million through HFC Assist to aid in cancer support services.
* Lightning goaltender Andrei Vasilevskiy is now a two-time winner of the Vezina Trophy after he was surprised with the trophy by Tampa police and a member of their K-9 unit who were investigating suspicious activity near his vehicle. Click here for more information.
* The Canadian winner of the Willie O’Ree Community Hero Award presented by Hyundai was announced during Game 3 on Sportsnet, with Doug Grandy, founder and coach of the Rink Rebels Female Hockey Organization, set to receive a $30,000 donation to continue supporting his community through hockey. Click here for more information.
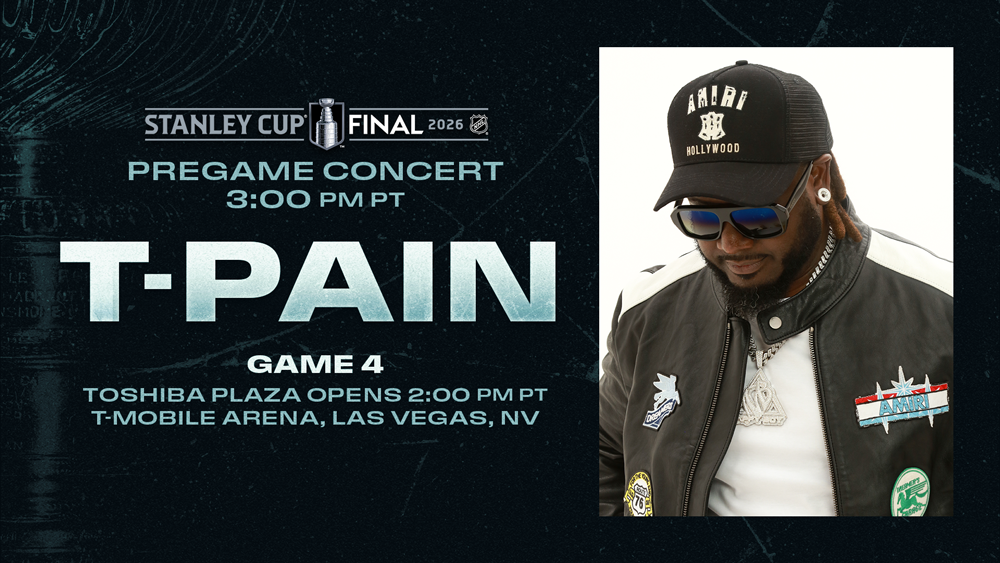
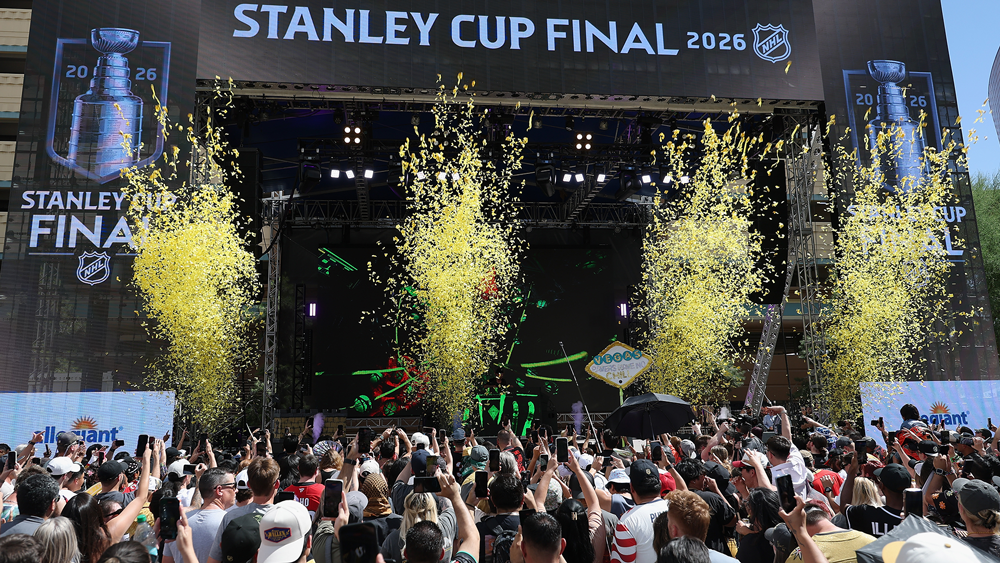
* The pre-game concerts for the 2026 Stanley Cup Final have made their way to Las Vegas, with ILLENIUM pumping up fans outside T-Mobile Arena before Game 3. The party also continued back in Raleigh with a packed towel-waving house at Lenovo Center for a Hurricanes Watch Party.
Díaz will be available for tonight’s game vs. Cleveland
Arlington, Texas — The Texas Rangers today announced the following transactions prior to tonight’s game against the Cleveland Guardians at Globe Life Field.
Catcher Danny Jansen placed on 10-day Injured List (right forearm strain), retroactive to June 3
Catcher Elias Díaz (#35) signed to one-year Major League contract
Infielder Josh Smith sent to Frisco (AA) on injury rehab assignment
The 35-year-old Elias Díaz (pronounced ee-LEE-ahs DEE-az) spent the beginning of the 2026 season within the Kansas City organization after signing a minor league contract with the Royals on February 24. The right-handed-hitting backstop had his contract selected from Triple-A Omaha on April 19 and appeared in 10 games/7 starts at catcher with the Royals, hitting .227 (5-22) with 2 home runs, 2 doubles, 5 RBI, and an .852 OPS. He was designated for assignment on May 22, outrighted to Omaha on May 26, and did not see game action before electing free agency on Wednesday. Díaz hit .219 (7-32) in 10 games at Triple-A in March and April prior to his elevation to the Majors.
A Maracaibo, Venezuela native, Díaz has played in parts of 12 Major League campaigns with Pittsburgh (2015-19), Colorado (2020-24), San Diego (2024-25), and Kansas City (2026), slashing .246/.300/.385/.685 (639-2594) with 73 home runs and 331 RBI in 840 games. From 2021-25, he caught 65 runners attempting to steal, ranking 3rd among N.L. catchers during the span behind only J.T. Realmuto (88) and Will Smith (82). Díaz earned his first career All-Star selection in 2023 with the Rockies and was named Most Valuable Player of the 2023 Midsummer Classic in Seattle, hitting a go-ahead, 2-run home run in the 8th inning to fuel a 3-2 victory for the National League. 2026 marks his 18th professional season since signing with the Pirates organization in 2009.
Jansen, 31, last appeared for Texas on Tuesday at St. Louis, entering the game in the 9th inning as a defensive replacement. In 41 games with the Rangers this season, he is batting .171 (21-123) with 3 home runs, one triple, 6 doubles, and 12 RBI while leading the club with 36 starts at catcher. This marks Jansen’s first time on the Injured List since March 25-April 15, 2024 with Toronto (right wrist fracture).
Smith, 28, will hit leadoff and serve as Frisco’s designated hitter tonight vs. Springfield at Riders Field. He has missed the Rangers’ last 29 games since being placed on the 10-day Injured List with a right glute strain on May 5 (retroactive to May 4). Smith has also dealt with left wrist inflammation and paused baseball activities from May 13-28 due to viral meningitis.
With today’s transactions, the Rangers now have 40 players on the club’s Major League roster, along with four players on the 60-day Injured List (RHP Carter Baumler and LHP’s Cody Bradford, Robert Garcia, and Jordan Montgomery).
BOSTON, MA – The Boston Red Sox today placed left-handed pitcher Jovani Morán on the 15-Day Injured List (retroactive to June 5) with left elbow inflammation. To fill his spot, Boston recalled left-handed pitcher Alec Gamboa from Triple-A Worcester.
Morán, 29, has pitched in 21 games (three starts) for Boston this season, posting a 3.00 ERA (11 ER/33.0 IP) while holding opponents to a .172 batting average (20-for-116). Selected by the Minnesota Twins in the seventh round of the 2015 First-Year Player Draft, the Puerto Rico native owns a 3.94 ERA (56 ER/128.0 IP) in 102 career Major League games (three starts) with the Twins (2021-23) and Red Sox (2025-26).
Gamboa, 29, made his Major League debut on May 5 against the Detroit Tigers, striking out two of his three batters faced in a scoreless, hitless inning. The left-hander has also pitched in eight games (six starts) for Worcester this season, recording a 3.66 ERA (13 ER/32.0 IP) with 30 strikeouts. Originally selected by the Los Angeles Dodgers in the ninth round of the 2019 First-Year Player Draft, the California native owns a 4.18 ERA (182 ER/391.2 IP) in 139 career minor league games (47 starts).
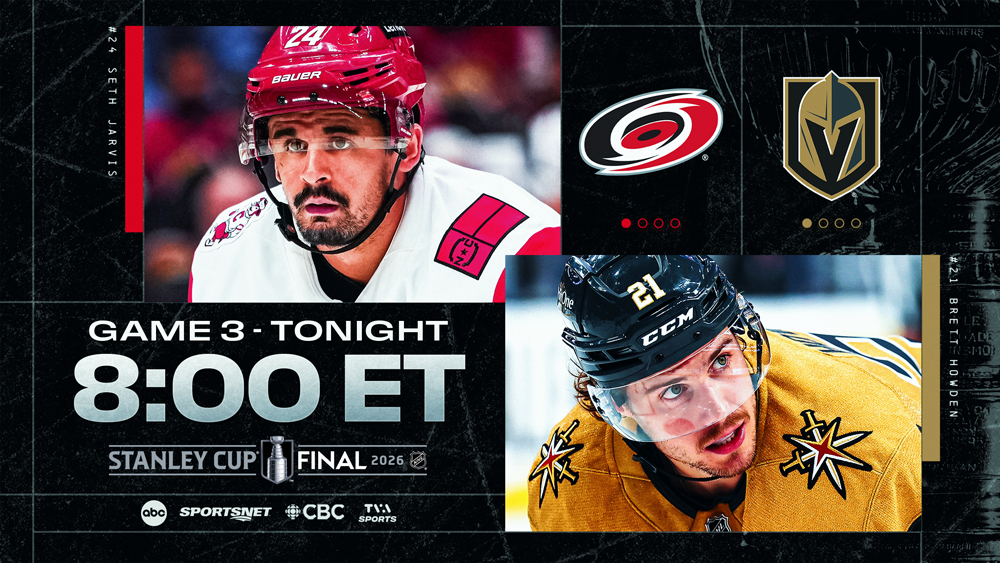
* The first Stanley Cup Final in NHL history where each team earned a multi-goal comeback win through the first two games shifts from Raleigh to Las Vegas for a pivotal Game 3 tonight when the Hurricanes and Golden Knights joust for a 2-1 series lead.
* When a best-of-seven Final is tied 1-1, the Game 3 victor goes on to win the series nearly 80% of the time (24-7; .774) including a 10-5 (.667) record for the home team and a 14-2 (.875) mark by the road club. More trends can be found in Saturday’s edition of #NHLStats: Live Updates.
* A couple of Canadiens stars surprised each other in the Montreal locker room with the Frank J. Selke and Lady Byng Memorial Trophy.
* The 2026 NHL Scouting Combine presented by Fanatics will conclude Saturday with fitness testing to close out a full week of meetings with clubs, media interviews, photoshoots and more.
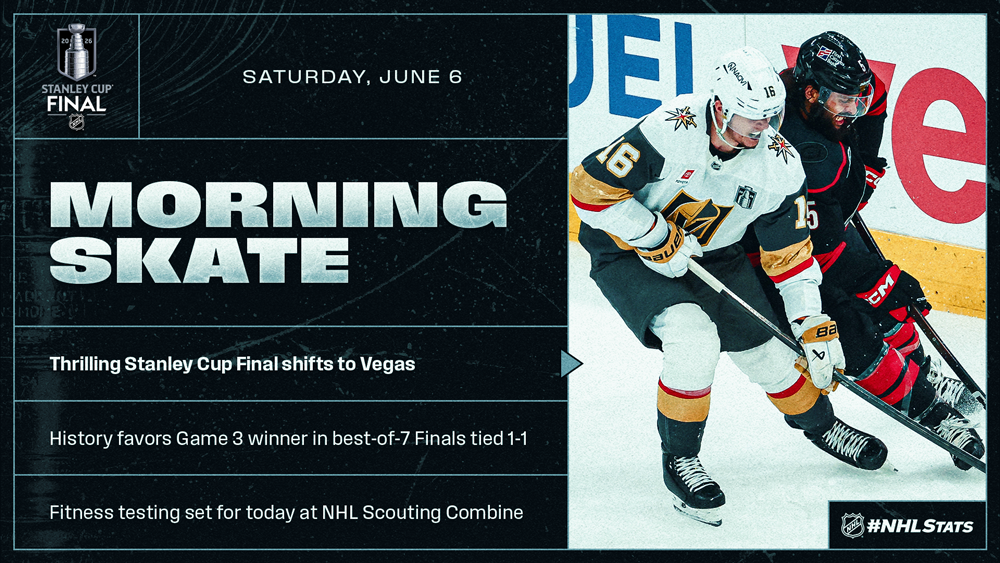
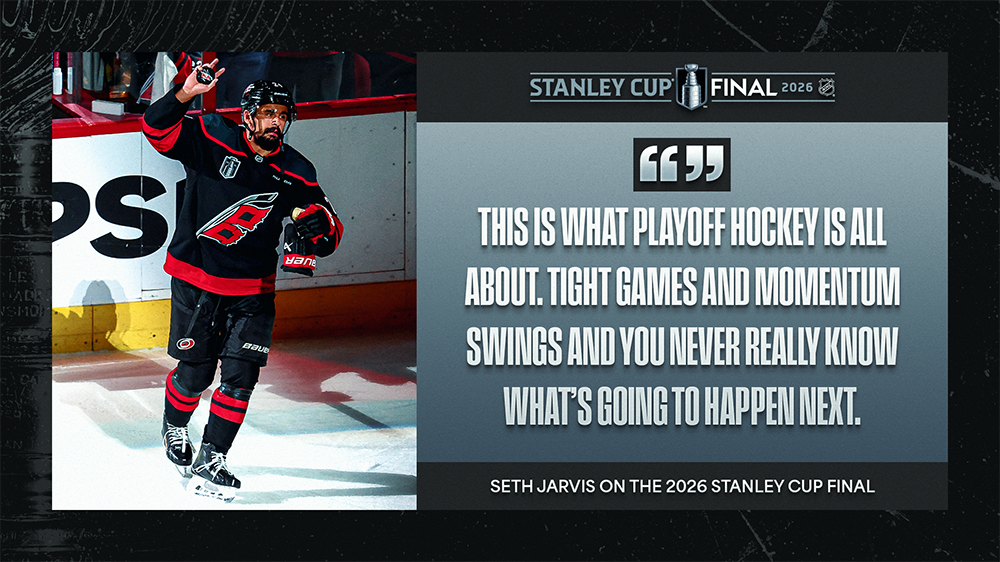
ENTERTAINING SERIES SHIFTS TO the “ENTERTAINMENT CAPITAL OF THE WORLD” Seth Jarvis and the Hurricanes are set to visit Brett Howden and the Golden Knights as the 2026 Stanley Cup Final shifts to T-Mobile Arena for Game 3 tonight after each of the championship series’ first two contests featuring thrilling finishes with 16 combined tallies, five tying markers and both teams earning a multi-goal comeback win.
* The tight games, momentum swings and unpredictability that overtime hero Jarvis mentioned during his media availability Thursday have been hallmarks of the Final dating to Mark Stone’s Cup-clinching hat trick in 2023, which was the last time T-Mobile Arena hosted a contest during the championship series. The 2024 Final saw the Oilers force a Game 7 after facing a 3-0 series deficit, while the 2025 one featured late tying tallies and overtime heroics that have continued into this year’s championship round.
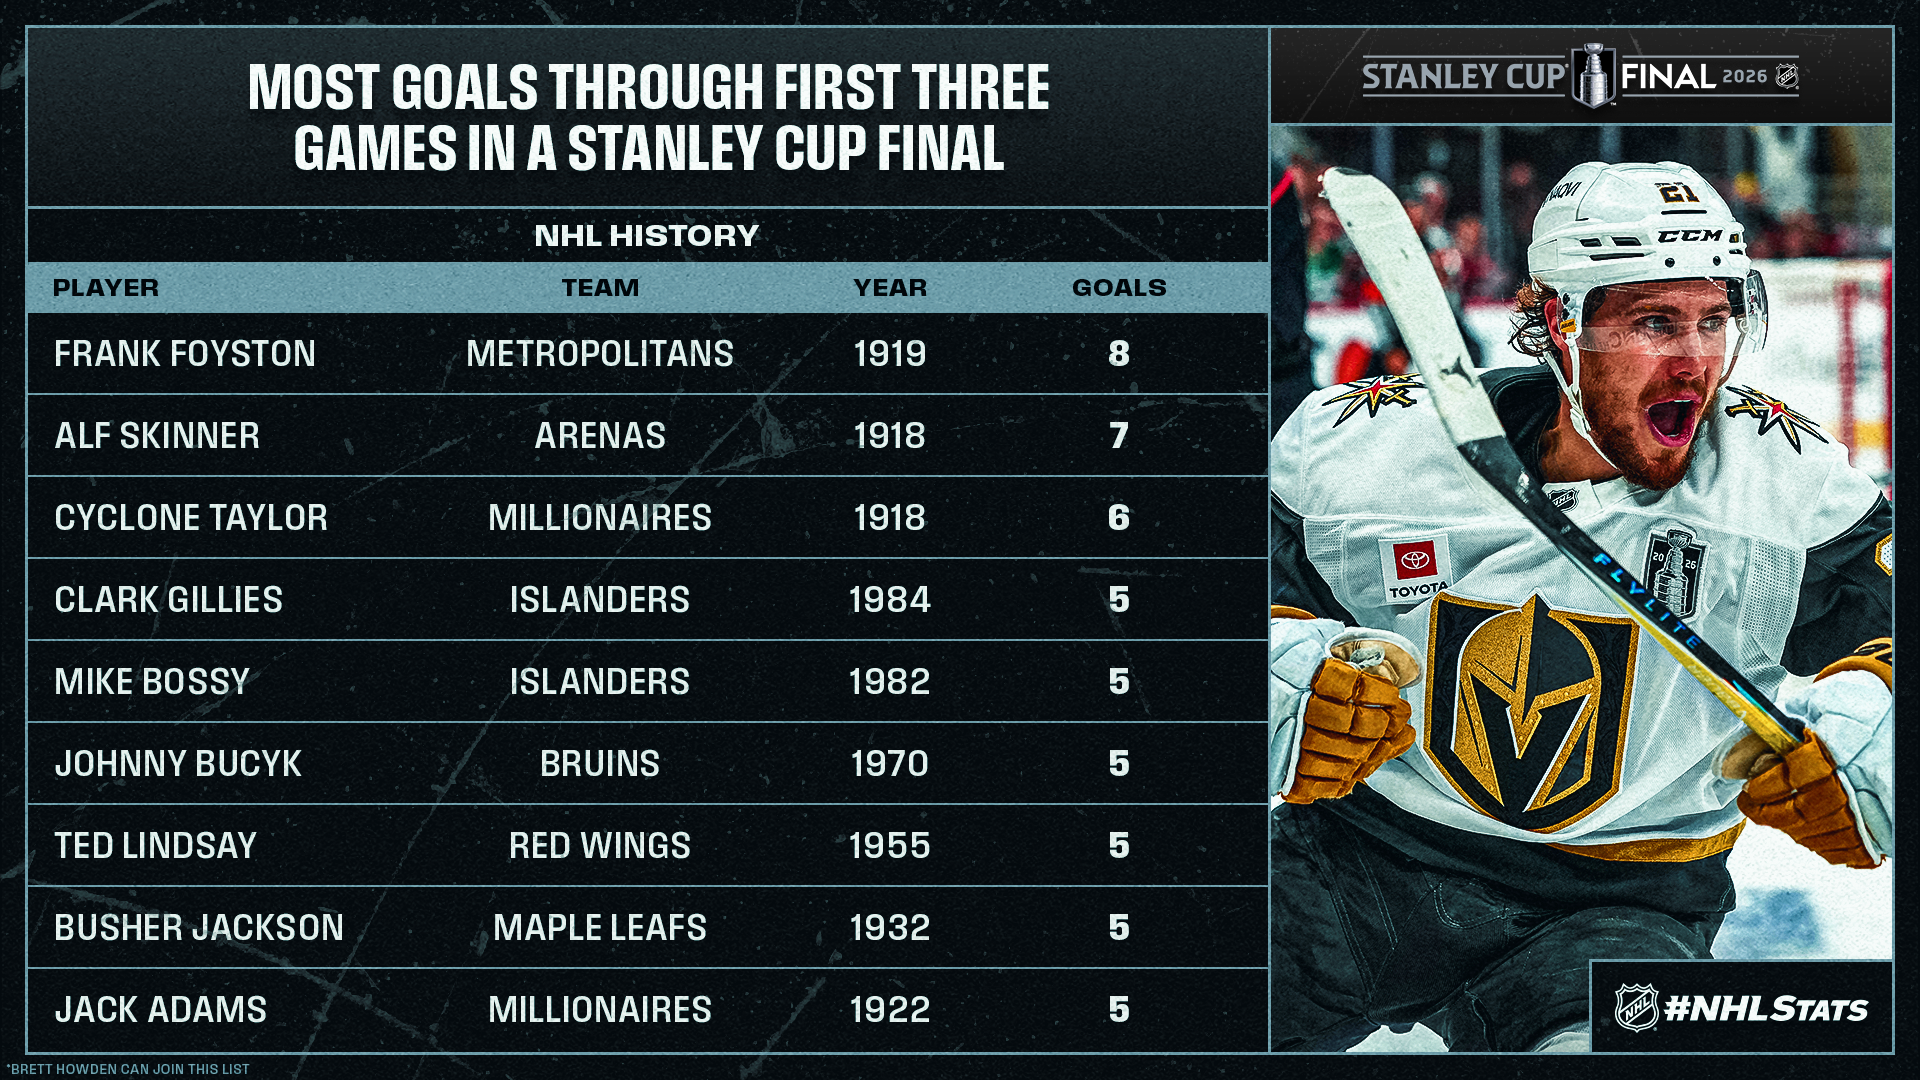
* Howden paces all players with three goals through the first two games of the Final and leads the League with 13 tallies in 18 contests this postseason, which are one more than his 58-game total of 12 from the regular season. He can become the sixth player over the last 40 years with four goals through the first three games in a championship series after Sam Bennett (4 in 2025 SCF), Brad Marchand (4 in 2025 SCF), Jonathan Marchessault (4 in 2023 SCF), Jake Guentzel (4 in 2017 SCF) and Mario Lemieux (4 in 1992 SCF). The most by an NHL player is held by Alf Skinner (7 in 1918 SCF), while skaters with non-NHL teams account for three of the nine instances of five or more.
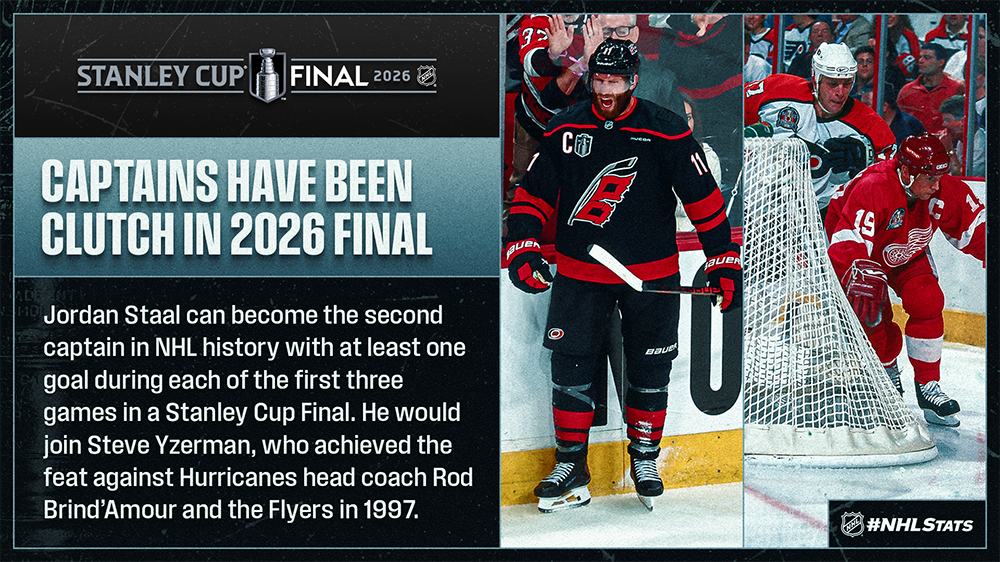
* Jordan Staal scored a goal in each of the Final’s first two games and fellow captain Stone had the tying tallying with 1:21 remaining in regulation Thursday. Staal captured the Cup with the 2009 Penguins and can surpass Chris Chelios (16 from 1986 MTL to 2002 DET) for the most years from one championship to the next in NHL history (17), while Stone can become the first player in the League’s modern era (since 1944) to serve as a franchise’s first captain and also captain the club to each of its first two titles. Staal can join one of Chelios’ longtime teammates as the NHL’s second captain with goals in each of a Final’s first three games.
NHL EDGE stats through the first two games of the 2026 Stanley Cup Final Highlights from the first two contests of the 2026 Stanley Cup Final through the lens of NHL EDGE Puck and Player Tracking technology:
* Seth Jarvis’ overtime winner in Game 2 was clocked with a shot speed of 80.05 mph, the second hardest resulting in a goal during the championship round behind Nikolaj Ehlers from when he opened the scoring just 25 seconds into the first period Tuesday (84.63 mph). NHL in ASL, the three-time Sports Emmy-nominated alternate telecast dedicated completely to the Deaf and hard of hearing community using American Sign Language, captured the series-tying goal. The NHL in partnership with P-X-P will produce every game of the Final and the telecasts are available to stream exclusively on the ESPN App for ESPN Unlimited plan subscribers in the U.S. as well as on Sportsnet+ in Canada.
* Brett Howden and Mark Jankowski had goals in Game 2 which featured alley-oop assists by Mitch Marner and Eric Robinson, respectively. Marner’s helper covered 91.3 feet while airborne and had a max height of 24.0 feet, while Robinson’s spanned 82.2 feet in the air and featured an apex of 19.7 feet.
* Robinson was clocked with a 23.53 mph speed burst when he attempted to negate an icing call just before Jankowski’s goal, which marked the fastest of the Final and one of the quickest this postseason. Alexander Nikishin’s blast at 14:17 of the third period in Game 1 was the hardest shot speed of the championship series so far (94.59 mph).
* Before Game 3, GRAMMY-nominated multi-platinum artist, producer and songwriter ILLENIUMwill headline a free concert on Toshiba Plaza outside T-Mobile Arena. The performance will begin at 3:00 p.m. PT.
COUPLE OF CANADIENS CAPTURE FRANK J. SELKE, LADY BYNG MEMORIAL TROPHY Nick Suzuki and Cole Caufield were named the 2025-26 recipient of the Frank J. Selke and Lady Byng Memorial Trophy, respectively, after Suzuki believed that he was surprising Caufield with the Lady Byng inside the Montreal locker room while not knowing that Caufield also was surprising him with the Selke.
* Suzuki joined Canadiens greats Bob Gainey and Guy Carbonneau as the franchise’s third winner of the Selke Trophy, which recognizes “the forward who best excels in the defensive aspects of the game” as selected by the Professional Hockey Writers Association. Gainey captured the award in each of the first four seasons it was presented (1977-78 through 1980-81), while Carbonneau claimed it three times (1987-88, 1988-89 & 1991-92).
* Caufield joined Mats Naslund (1987-88) and Toe Blake (1945-46) as Montreal’s third player to win the Lady Byng since it was first presented in 1924-25. The award goes “to the player adjudged to have exhibited the best type of sportsmanship and gentlemanly conduct combined with a high standard of playing ability” as selected by the Professional Hockey Writers Association.
NHL SCOUTING COMBINE CONCLUDES SATURDAY WITH FITNESS TESTING Gavin McKenna (No. 1-Ranked North American Skater) was one of six of the NHL top prospects who met with the media Friday before the 2026 NHL Scouting Combine presented by Fanatics concludes with fitness testing Saturday. McKenna sat alongside Keaton Verhoeff (No. 4-Ranked North American Skater), two players who played in the NCAA last season with McKenna finishing fifth in scoring across the league (15-36—51), while Verhoeff led all draft-eligible defensemen (6-14—20). Verhoeff started as a goaltender before moving to defense and didn’t play his last game in net until age 11 – when asked if he could stop a McKenna shot he joked, “I think I could get in front of it, but it wouldn’t feel too good. He’d probably go around me a couple times too.”
NHL SCOUTING COMBINE: RUDOLPH ACHIEVES ON AND OFF THE ICE Daxon Rudolph has found much success on the ice, but as NHL.com writes from the 2026 NHL Scouting Combine presented by Fanatics, his achievements are just as impressive off it. The Prince Albert Raiders defenseman, who was a finalist for the Bill Hunt Memorial Trophy as best defenseman in the WHL in 2025-26, was also a finalist for the league’s Scholastic Player of the Year award last season – an accomplishment that made his mother, Renee, proud.
• 2-0 IN FINALS: Teams that win the first two games of the NBA Finals have gone on to win the series 86.5% of the time (32-5).
• 2-0 ON THE ROAD: The Knicks are the third team in NBA Finals history to win the first two games of a series on the road, joining the 1992-93 Chicago Bulls (vs. Phoenix Suns) and the 1994-95 Houston Rockets (vs. Orlando Magic). The Bulls and Rockets both went on to win the NBA championship – Chicago in six games and Houston in four games.
• 13 STRAIGHT: The Knicks won their 13th consecutive playoff game, the second-longest winning streak in a single postseason in NBA history. The 2016-17 Golden State Warriors hold the record with 15 straight wins.
• ROAD RECORD TIED: The Knicks won their eighth consecutive road playoff game, tying the 2000-01 Los Angeles Lakers for the longest road winning streak in a single postseason.
• TWIN COMEBACKS: The Knicks are the first team to win the first two games of an NBA Finals series after trailing by 10+ points in each game since the Golden State Warriors in 1975 (vs. Washington Bullets). … The Knicks are the sixth team since 1971 to win back-to-back NBA Finals games after trailing by 10+ points in each game. They are the first to accomplish the feat since the Miami Heat in 2012 (vs. Oklahoma City Thunder).
• SPURS AT HOME: The Spurs lost back-to-back home games for the first time since Dec. 29 of the regular season (losses to the Utah Jazz on Dec. 27 and Cleveland Cavaliers on Dec. 29).
• JALEN BRUNSON: Brunson (20 points, 5 rebounds, 6 assists, 5 steals) is the 10th player to record 20+ points, 5+ rebounds, 5+ assists and 5+ steals in an NBA Finals game since steals were first recorded in the 1973-74 season. He is the first Knicks player to reach those marks in a Finals game.

 vs. Baltimore Orioles (31-35)")

 vs. New York Knicks (2-0)")


-05093426.png)